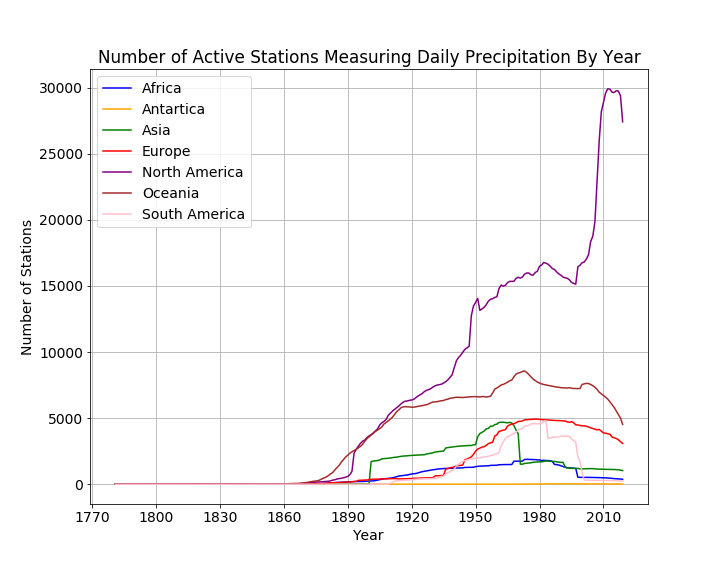
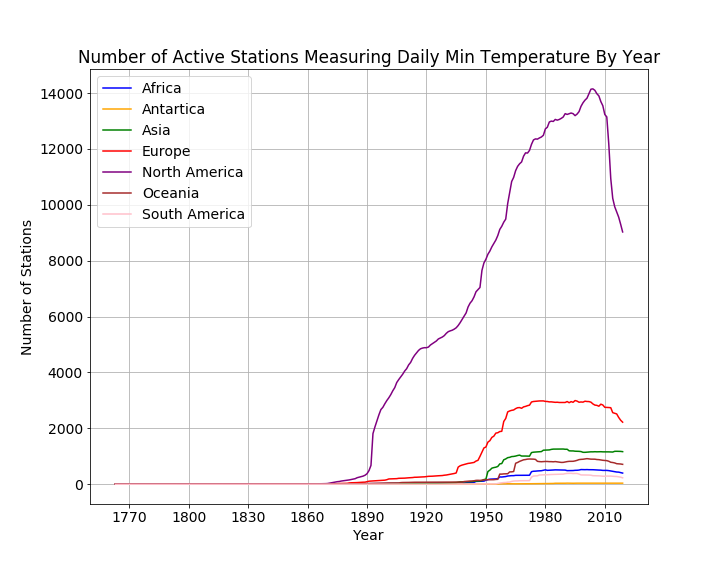
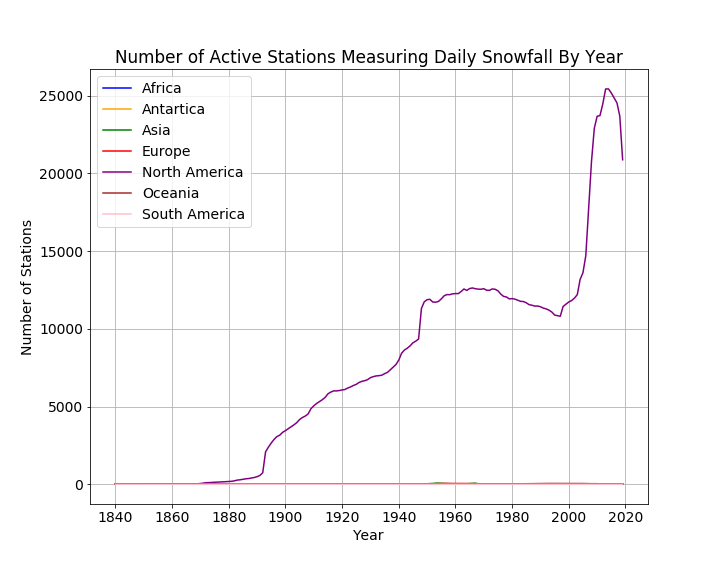
Number of Active Stations By Year
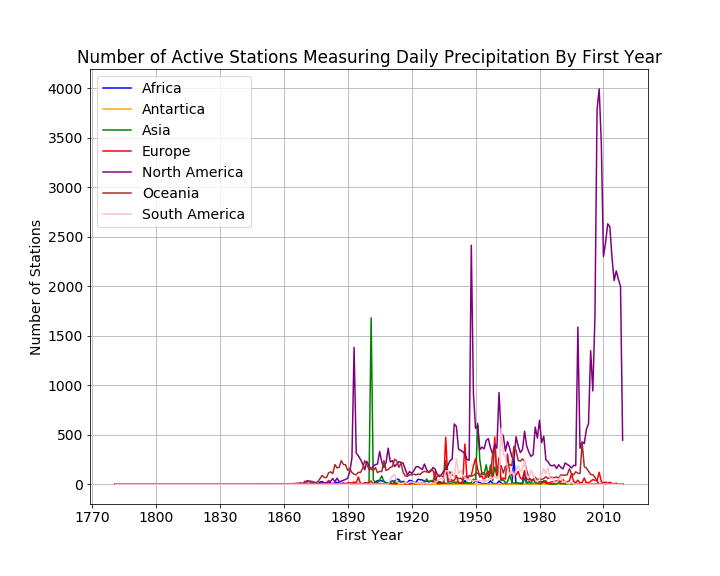
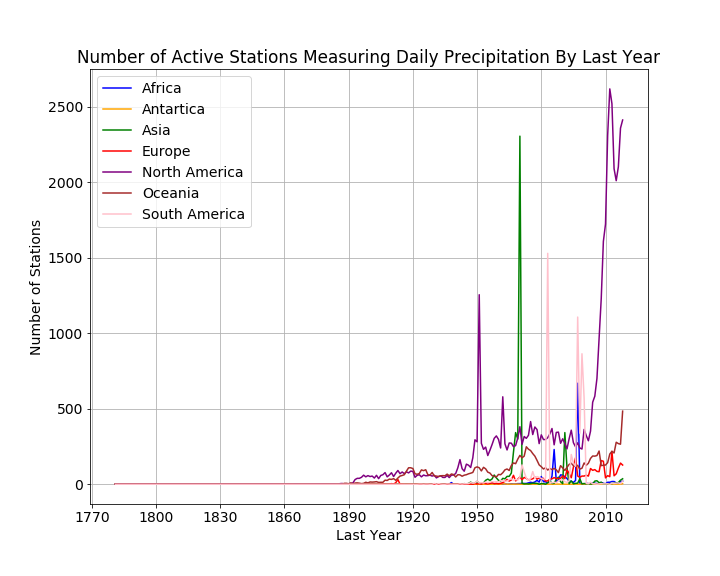
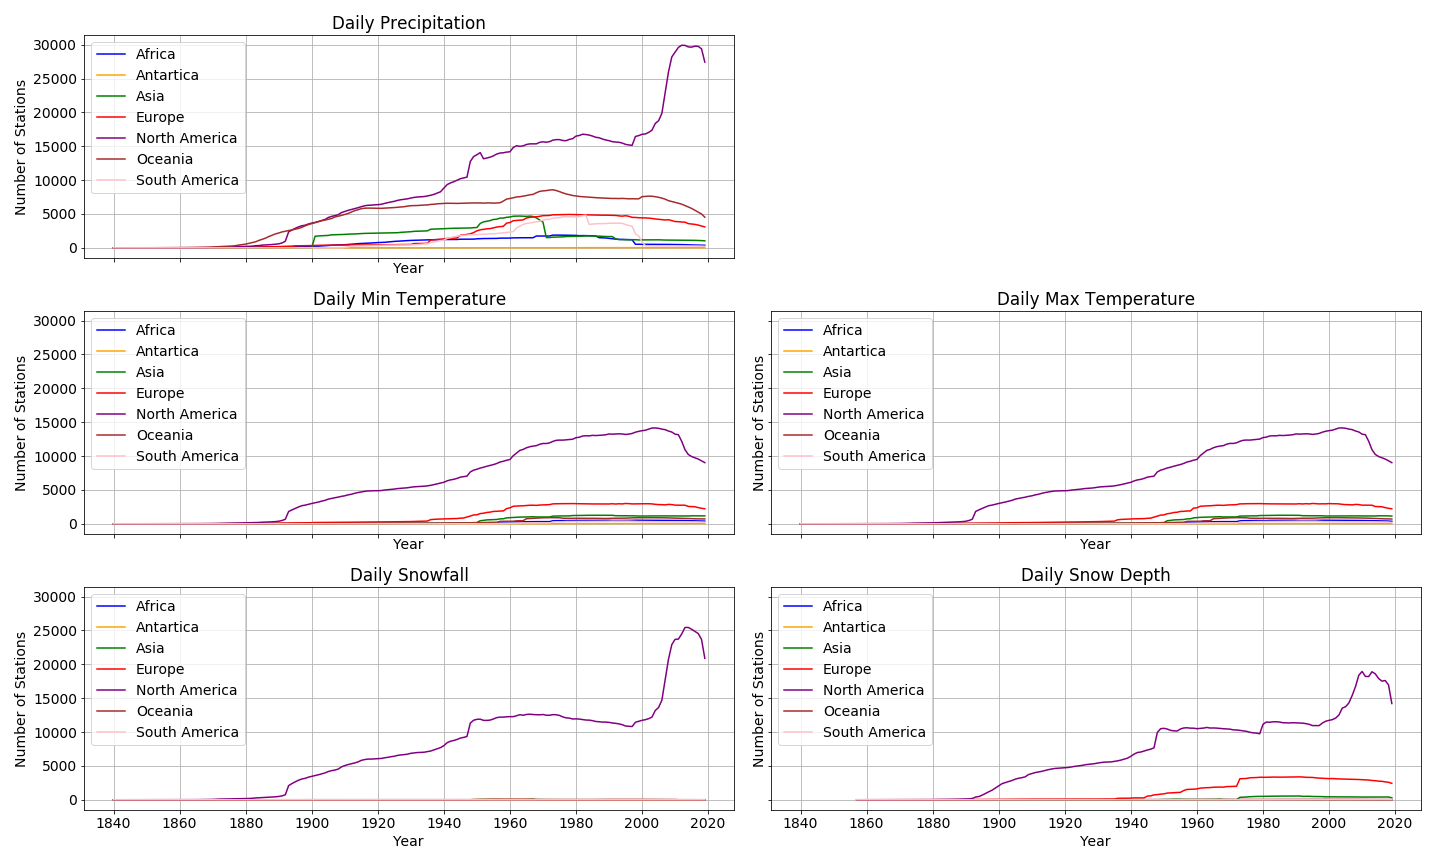
The following plots give the number of stations reporting the different types of observations in a given year. This is measuring the number of stations active in a given year and indicates how the size of the archive is changing over time.
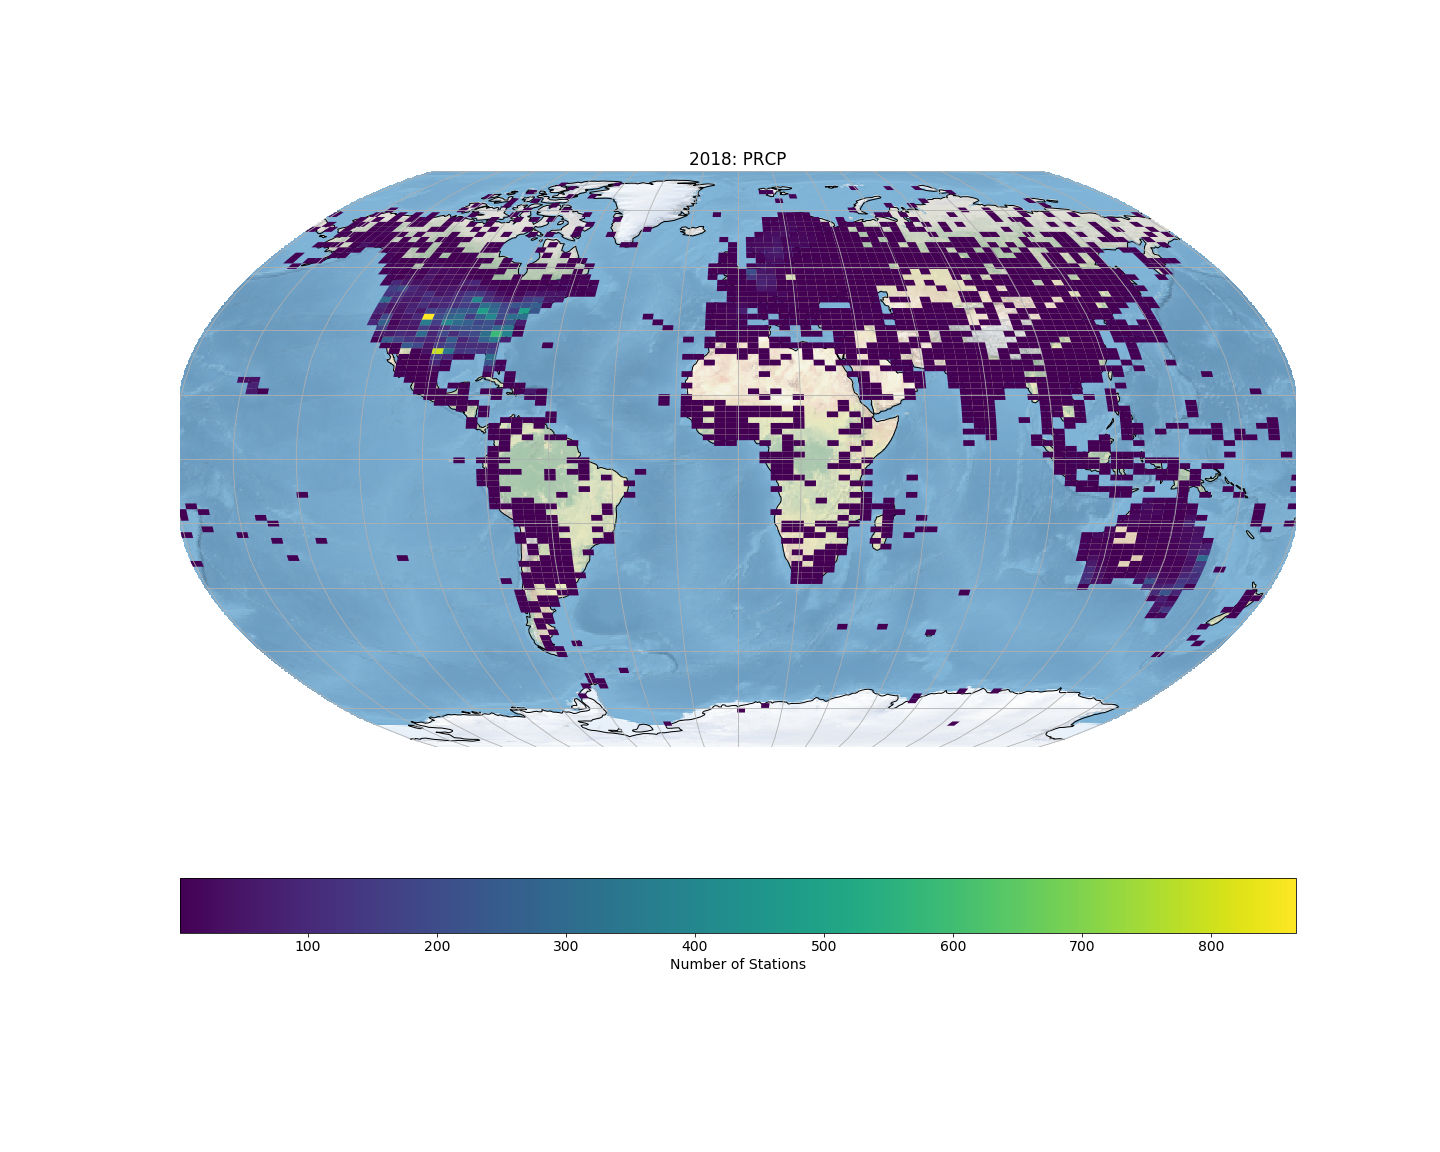
Daily Precipitation
Daily Minimum Temperature
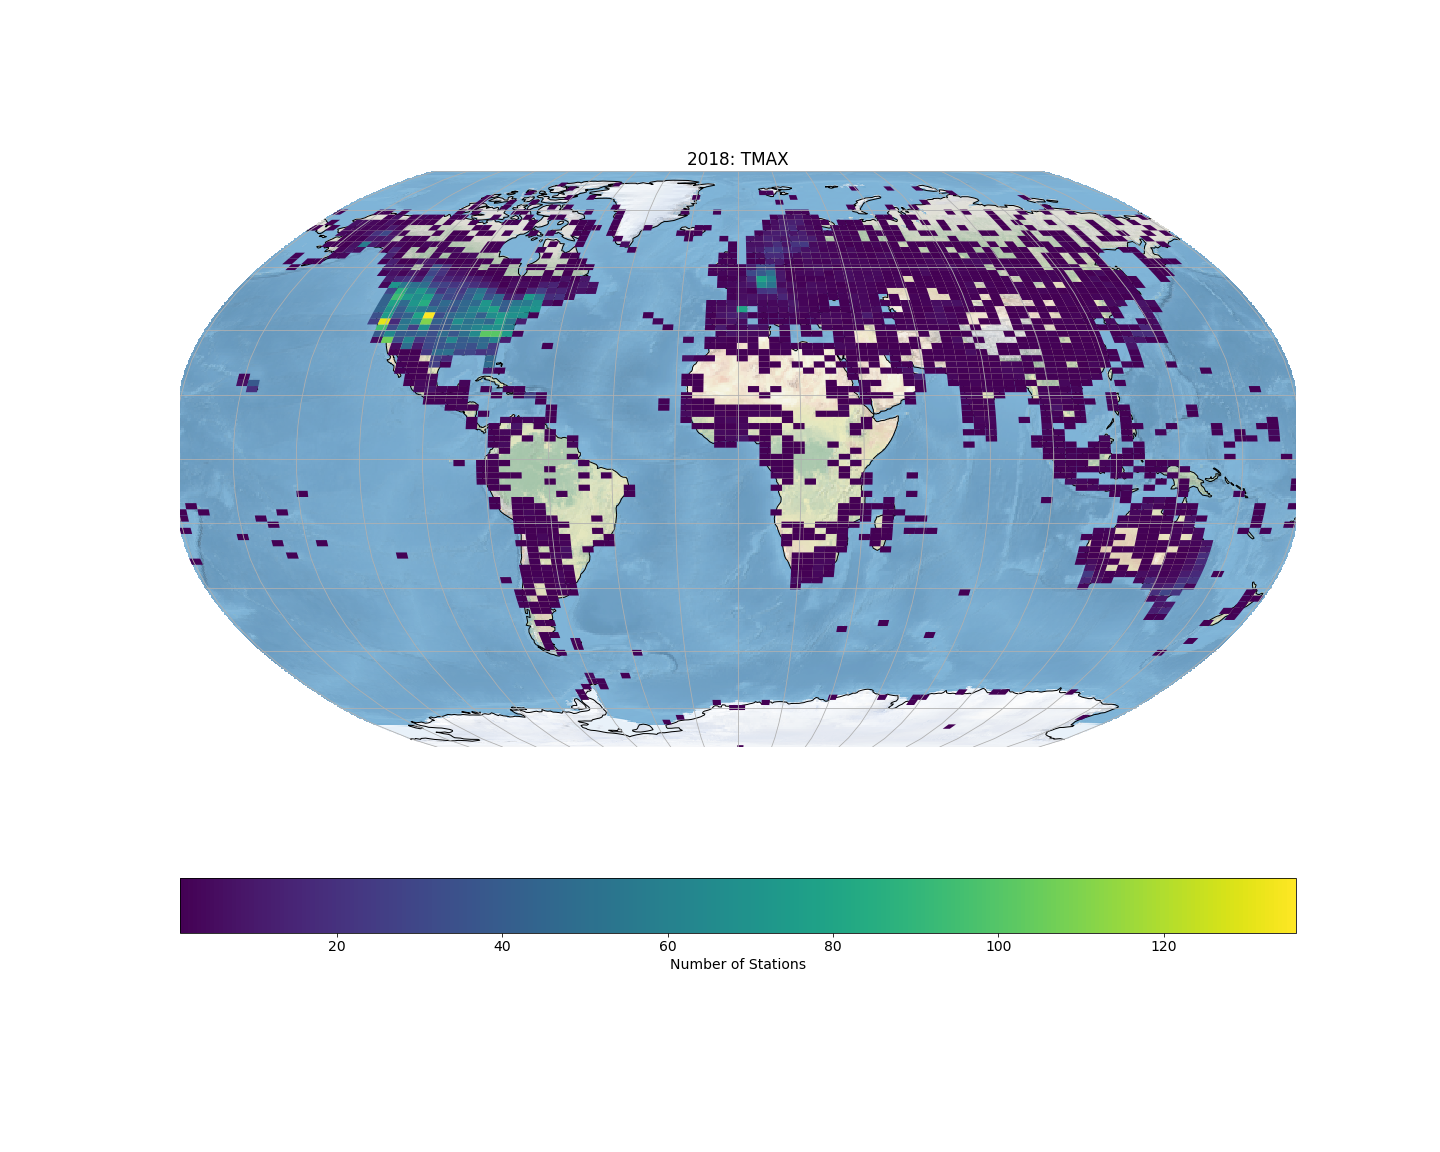
Daily Maximum Temperature

Daily Snowfall
Daily Snow Depth
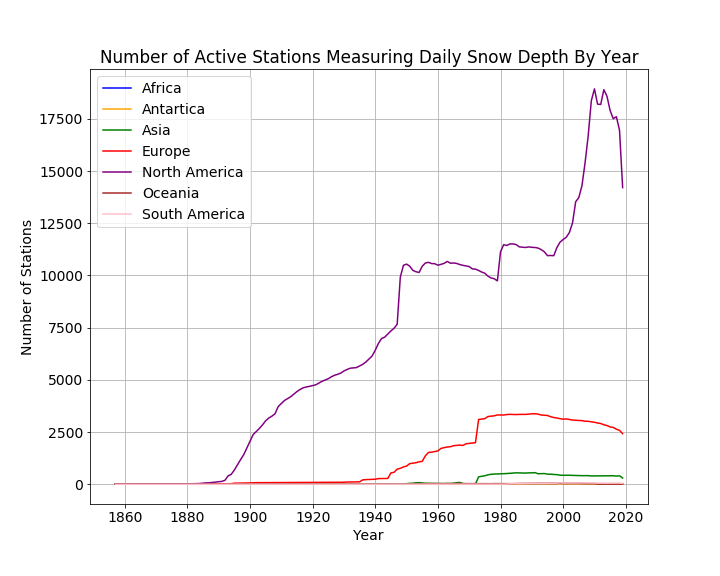
Note that the plots are not given in the same scales. This was done to show more detail for the different measurements across the continents.
For each of the measurements, the largest number of stations are in North America. We can also see the growth of stations in the archive over time followed by an eventual decline. The timing of the decline varies with the continent. For example, in Asia, there is an abrupt decline in number of precipitation stations in the late 1960s (as discussed in Menne et. al. (2012)). There is a gradual decline in precipitation stations in the archive for Oceania beginning in the 1970s. In South America there are two sharp declines in the number of daily precipitation stations; the first, smaller decline occurred in the early 1980s while the larger decline occurred in the late 1990s.
The following plot gives the above five plots with fixed axes. Menne et. al. (2012) present similar plots in their paper.
Menne, M.J., I. Durre, R.S. Vose, B.E. Gleason, and T.G. Houston, 2012: *An overview of the Global Historical Climatology Network-Daily Database*. Journal of Atmospheric and Oceanic Technology, 29, 897-910, doi:10.1175/JTECH-D-11-00103.1.
Visualizations