Density of Stations Reporting Maximum Temperature
The following plots give the density of stations reporting the daily maximum temperature throughout a particular time interval.
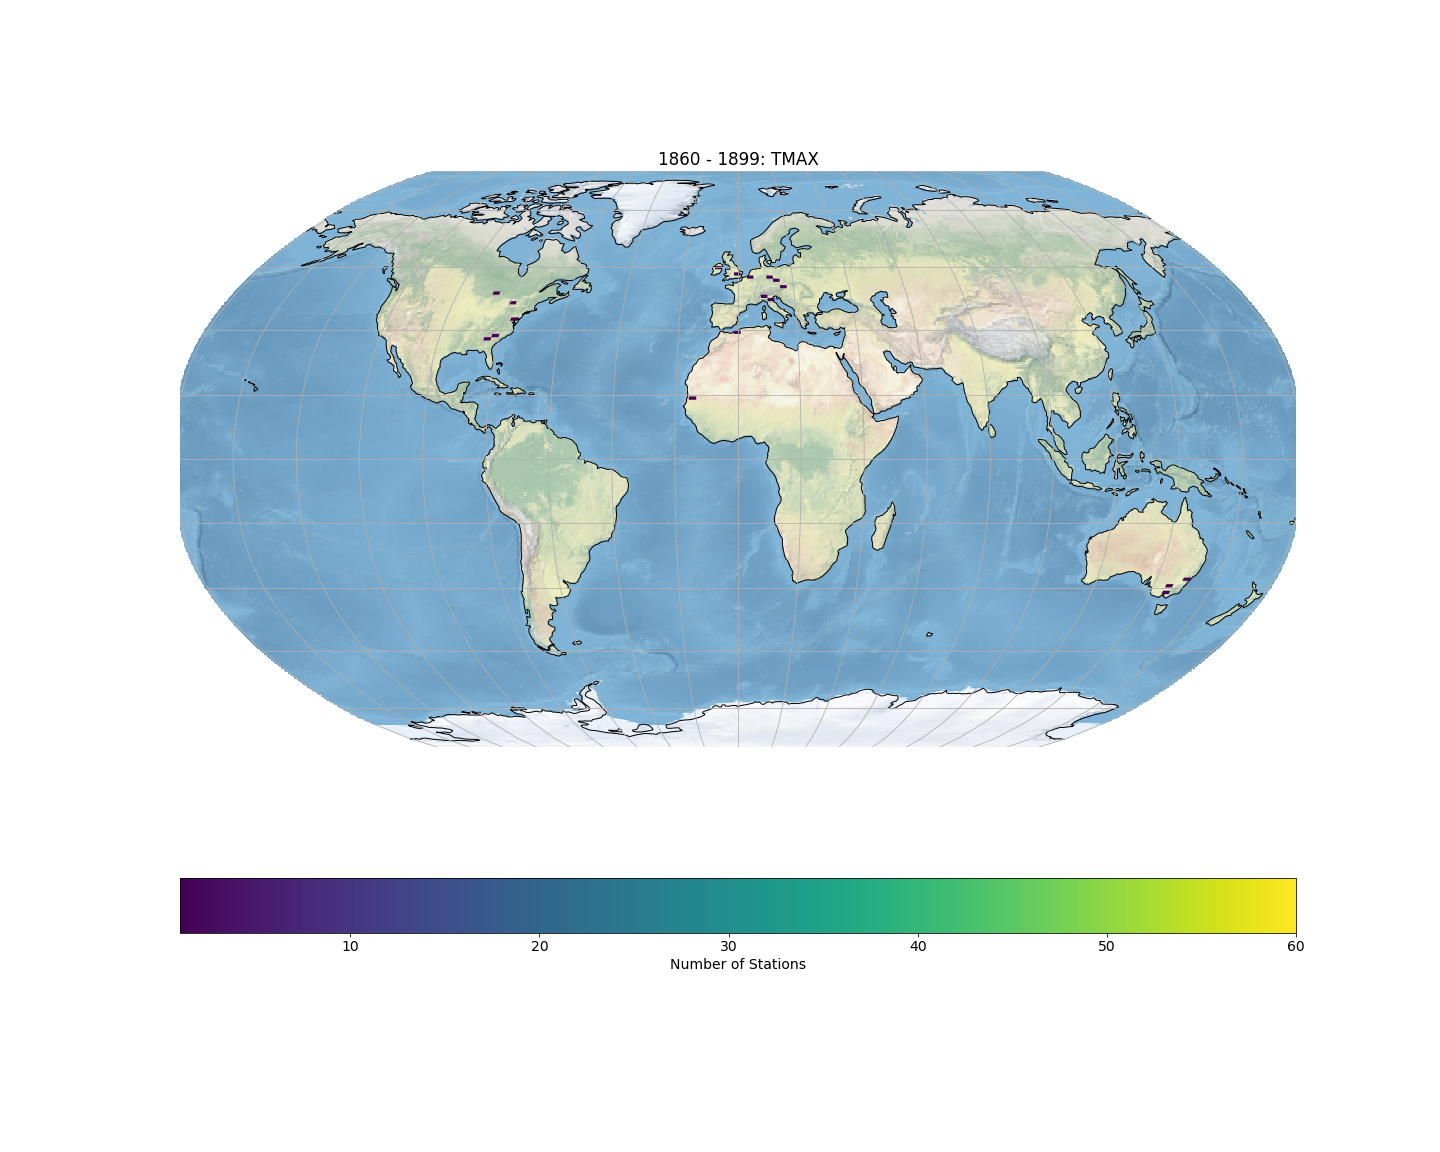
1860-1899
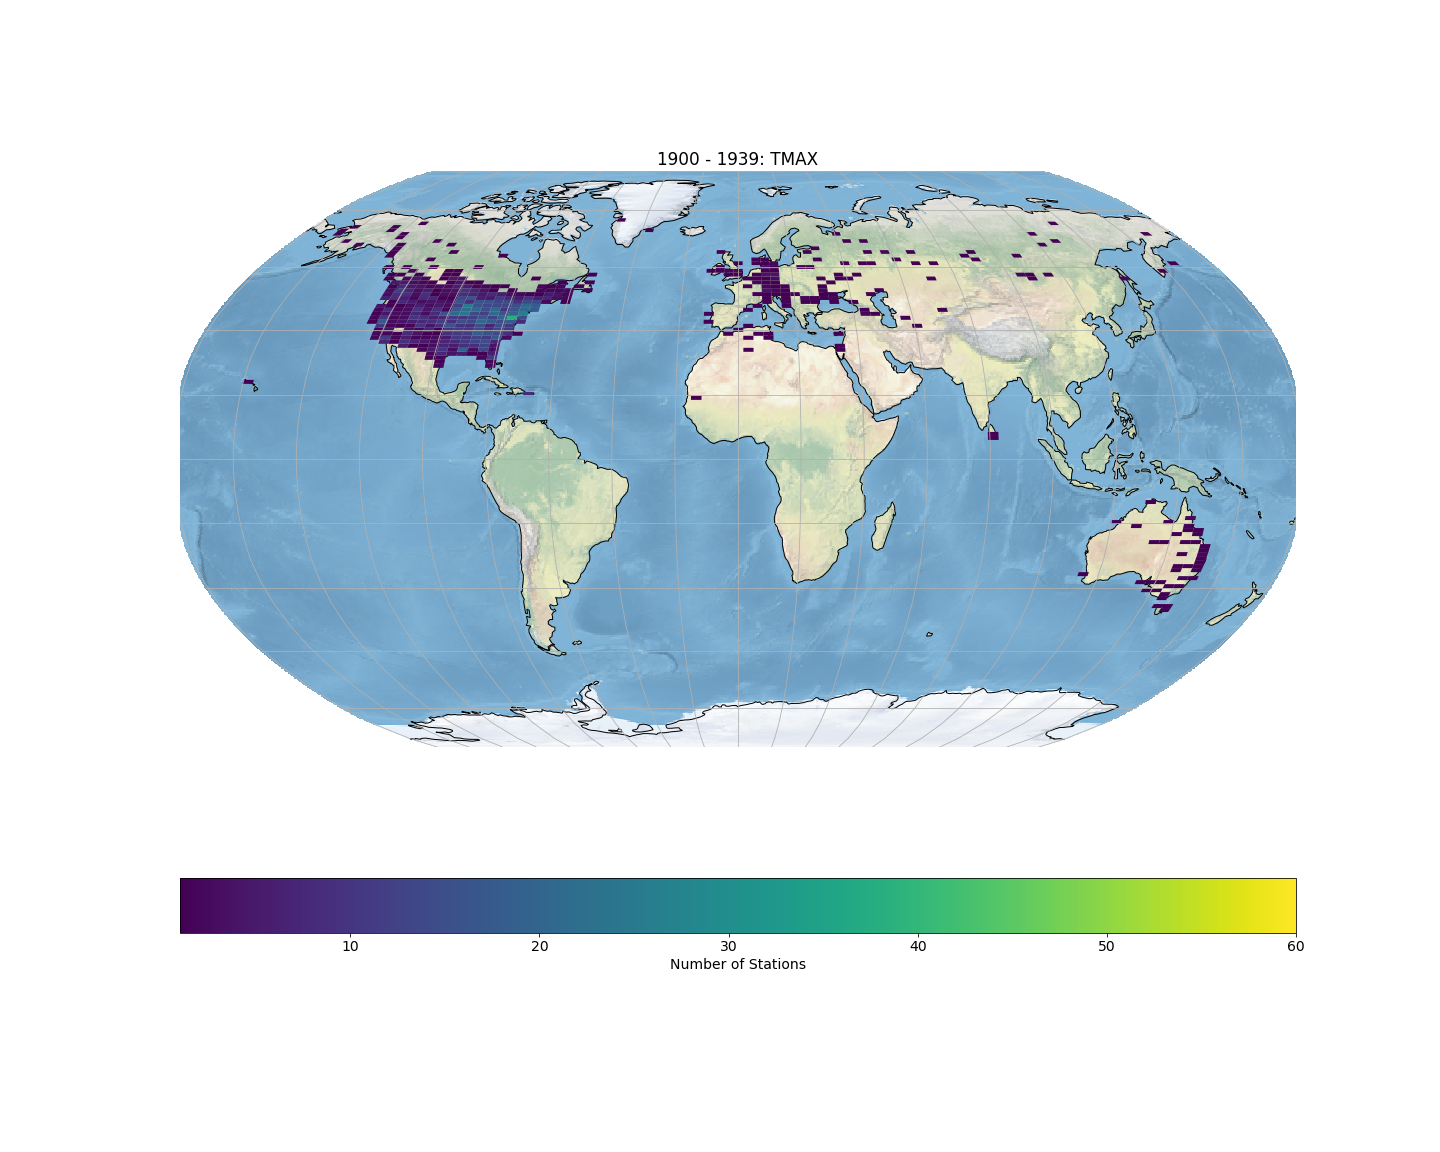
1900-1939
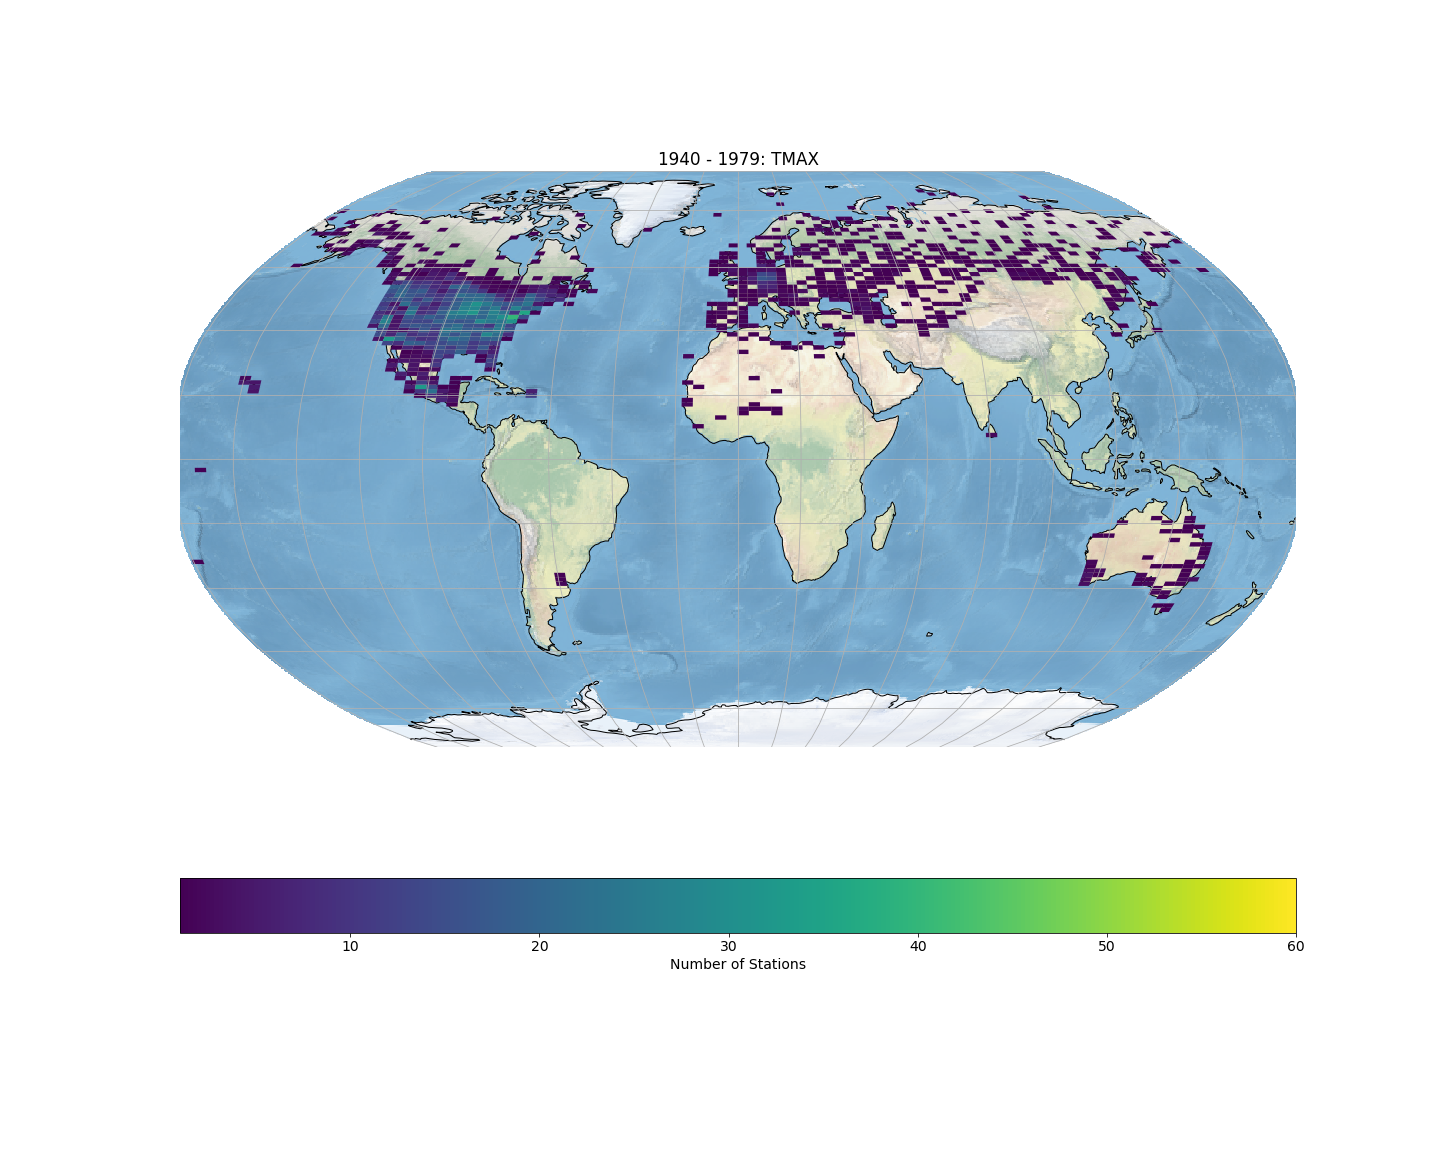
1940-1979
1980-2019
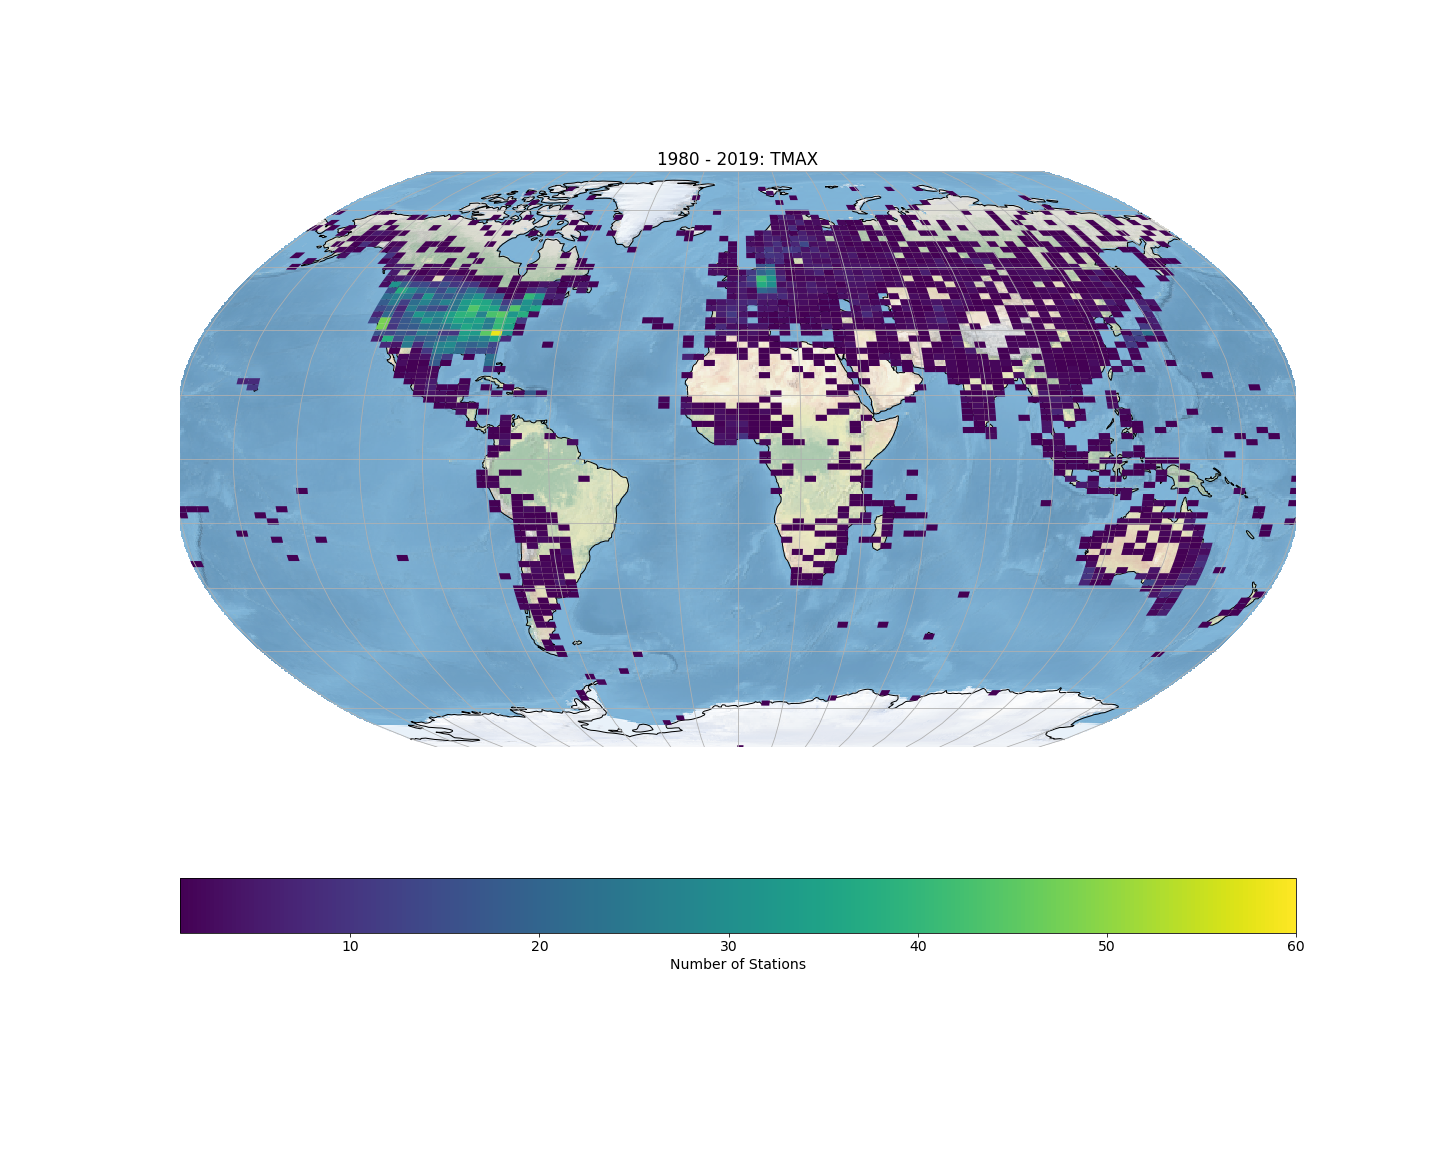
We can see the addition of station data to the archive over time and the expanding spatial coverage of measurements. The United States has the densest network of stations in the archive. The density across the globe increases in each time interval with the United States having the highest concentration of stations. Each density plot has the same scale.
There are only 19 stations that record the maximum temperature (TMAX) over the enire time frame of 1860-1899. There are 2405 stations reporting TMAX throughout 1900-1939, 4885 stations reporting TMAX throughout 1940-1979, and 7502 stations reporting TMAX throughout 1980-2019.
Menne et. al. (2012) present similar plots in their paper; however, for our plots, a station is included in the density plot for the years 1900-1939 only if the station is active for the entire 40 years of that time interval. The benefit of this approach is that it gives more of an indication of how consistently areas of the globe are covered by reporting stations over time. Stations than only record data for a small time frame would be excluded from this plot. The drawback of this approach is that it would exclude stations that report from say 1920-1970 since the endpoints do not span one of the chosen cut-offs in the graphs.
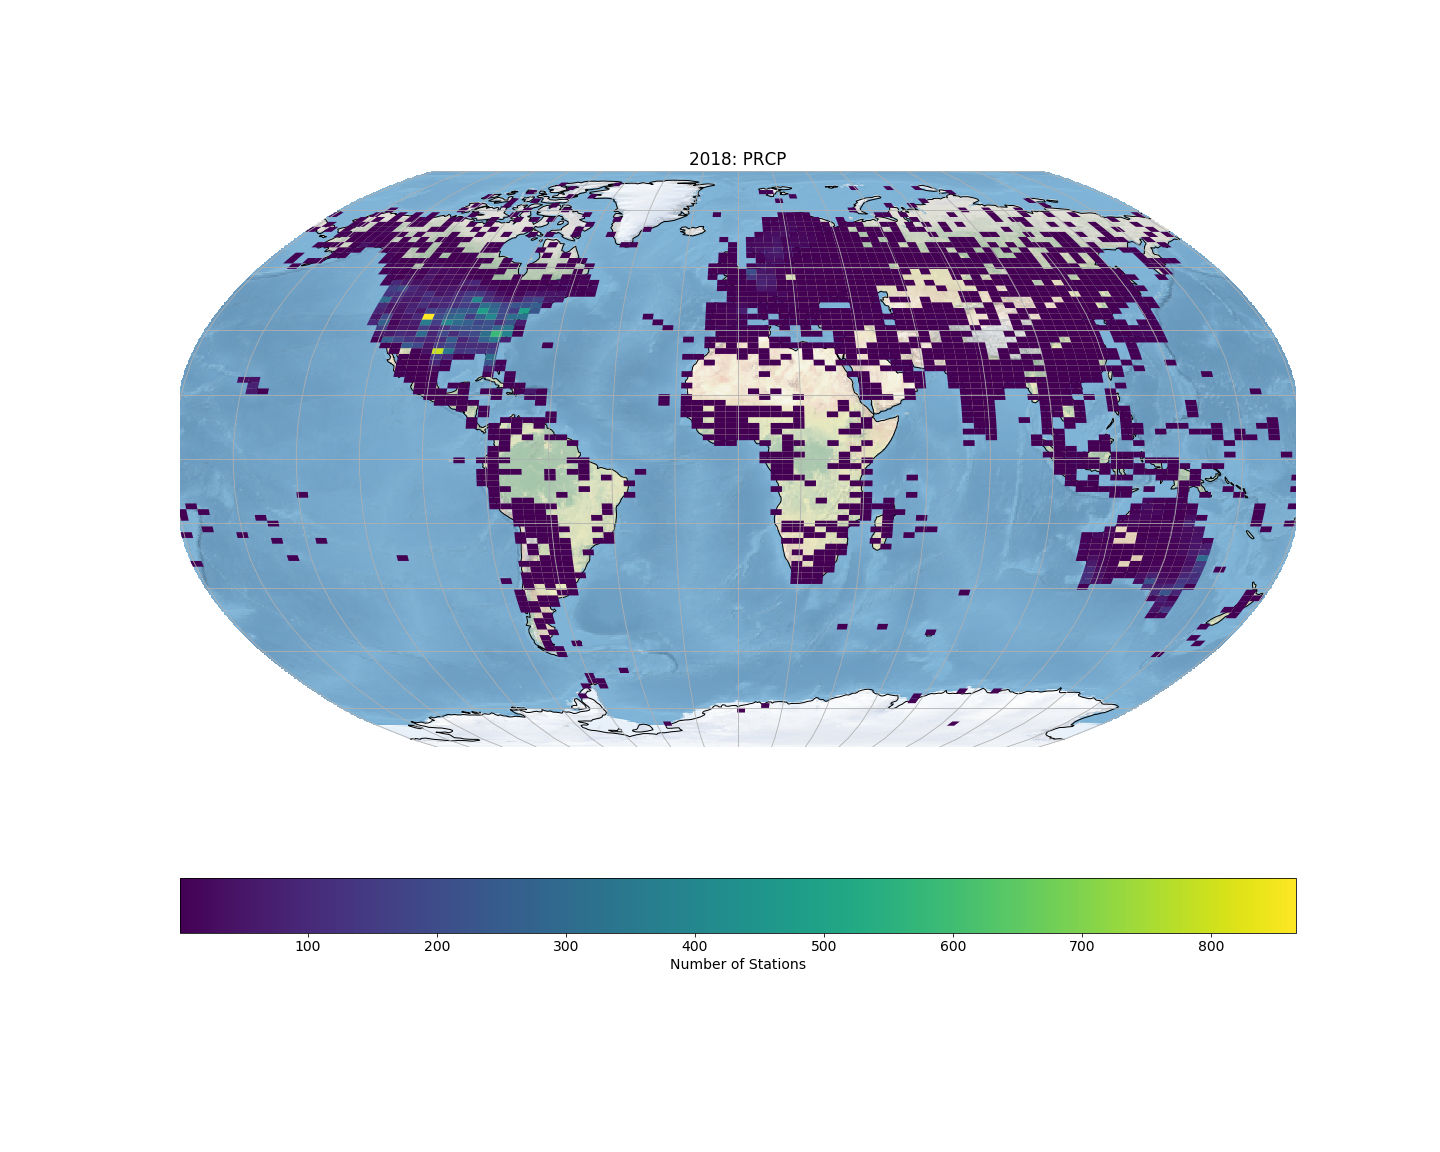
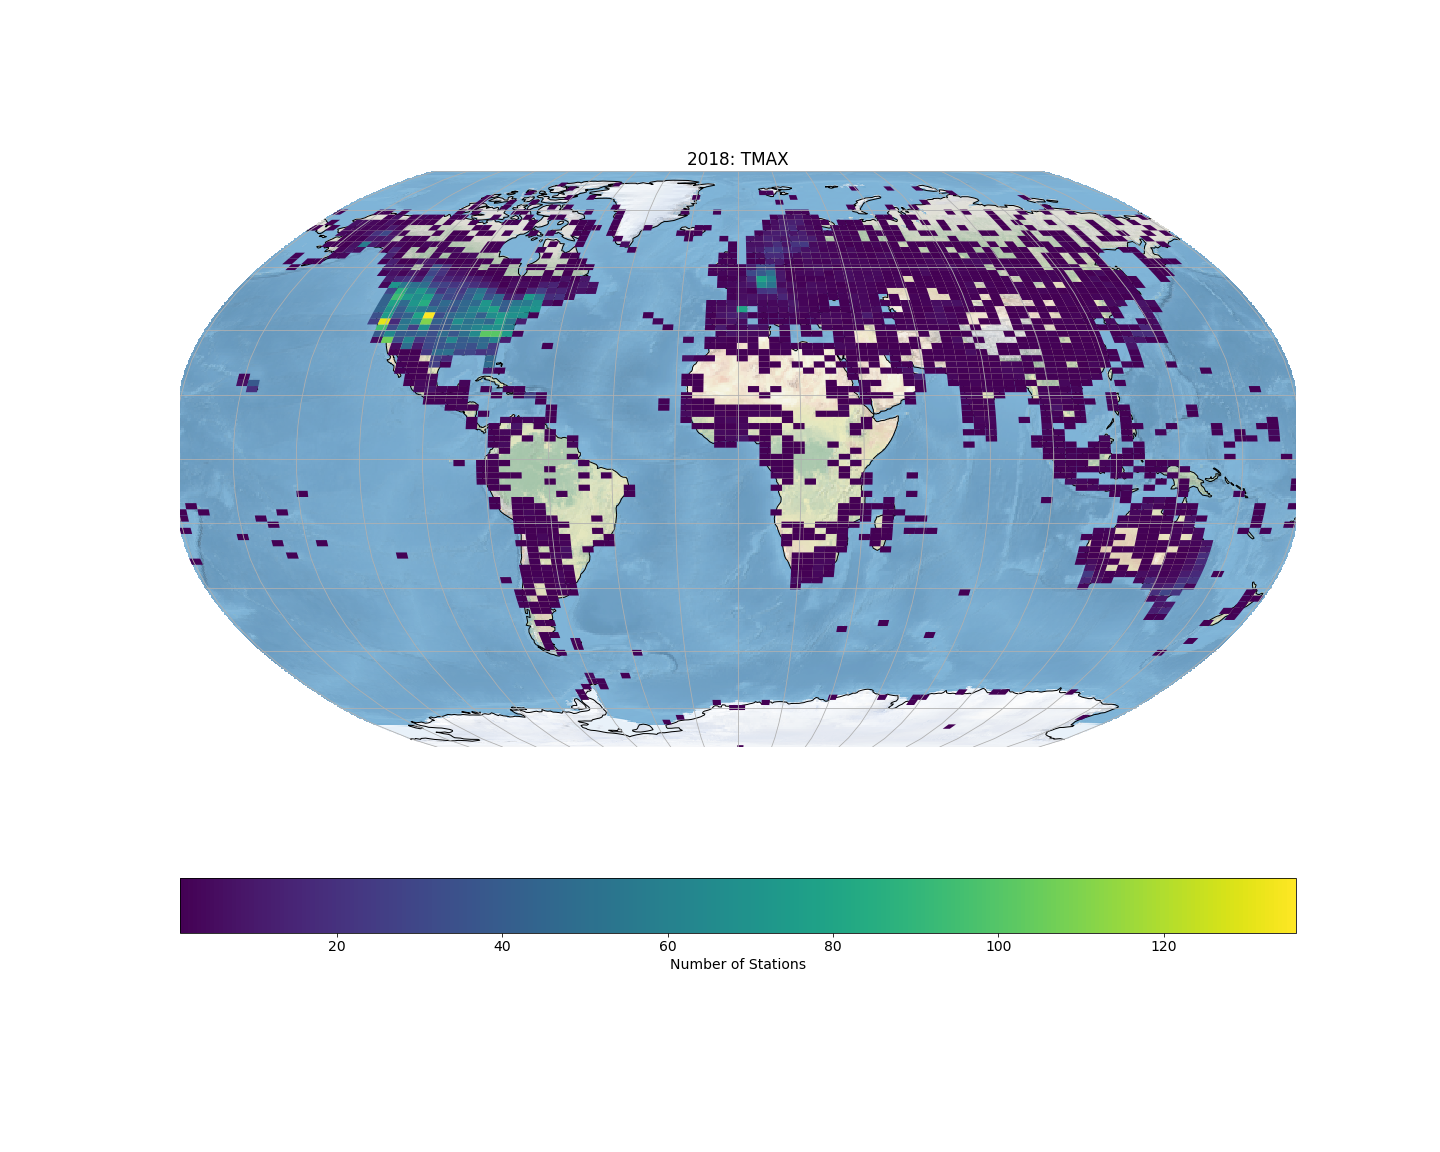
The final plot given below gives the density of stations reporting TMAX in 2018
Menne, M.J., I. Durre, R.S. Vose, B.E. Gleason, and T.G. Houston, 2012: *An overview of the Global Historical Climatology Network-Daily Database*. Journal of Atmospheric and Oceanic Technology, 29, 897-910, doi:10.1175/JTECH-D-11-00103.1.
Visualizations