Number of Active Stations By Last Year of Record
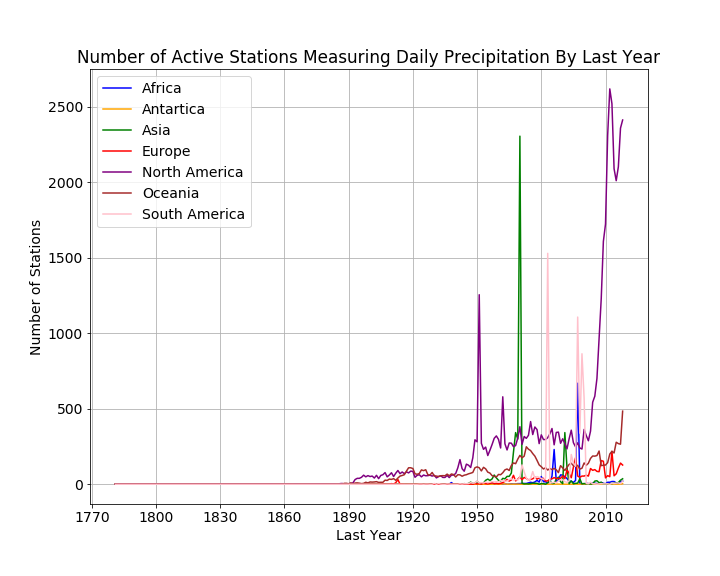
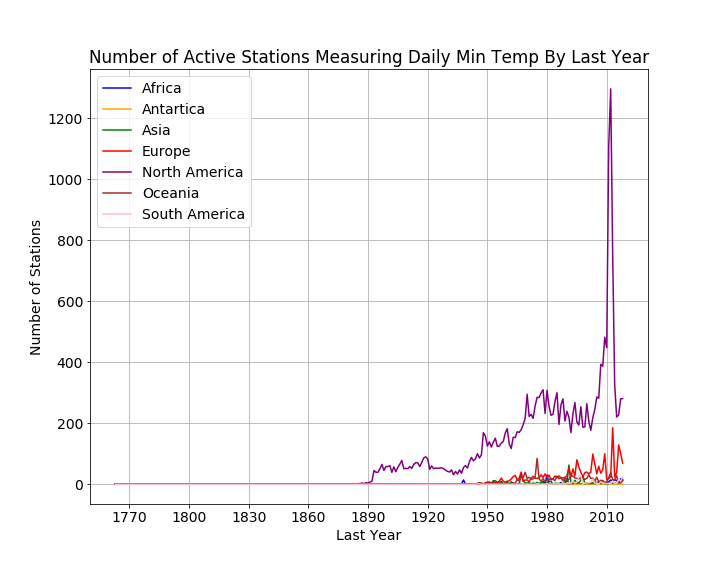
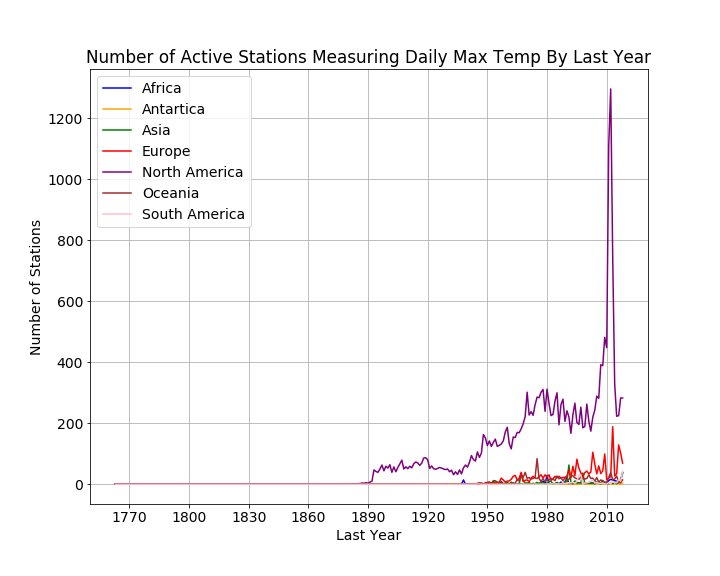
The following plots give the number of stations reporting the different types of observations in their last year. This is measuring the decline of station data over time as stations are dropped from the archive. Note that we do not include stations for which the last year is 2019 since these may still be active.
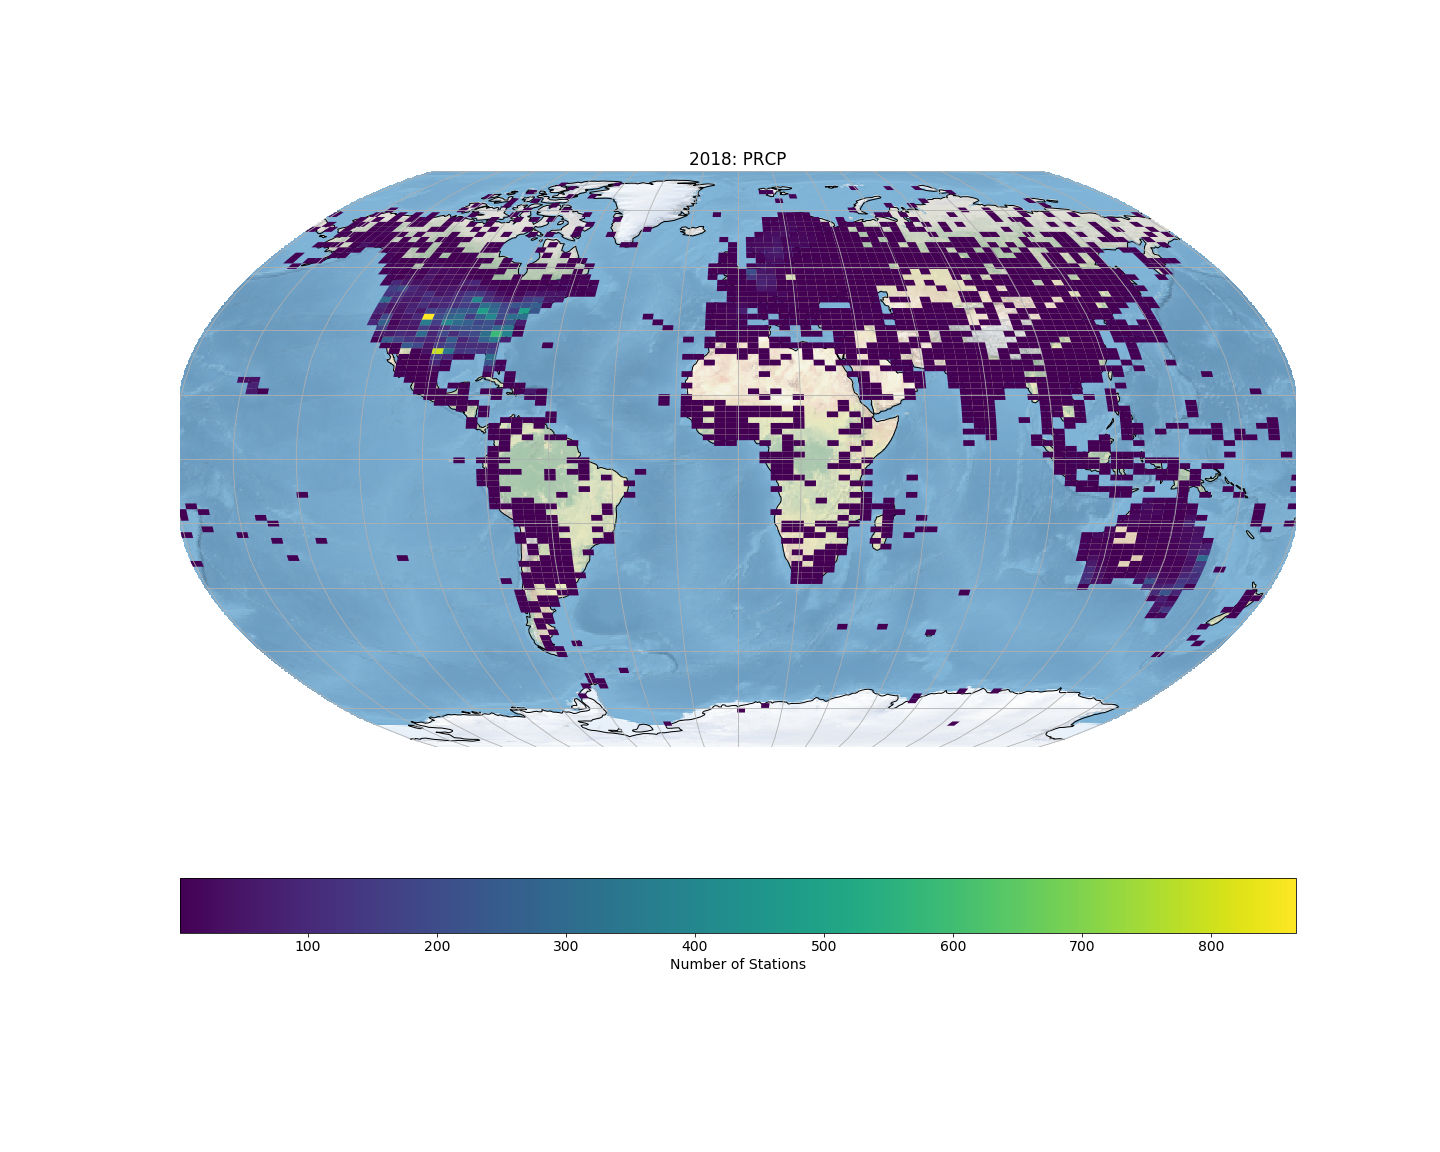
Daily Precipitation
Daily Minimum Temperature
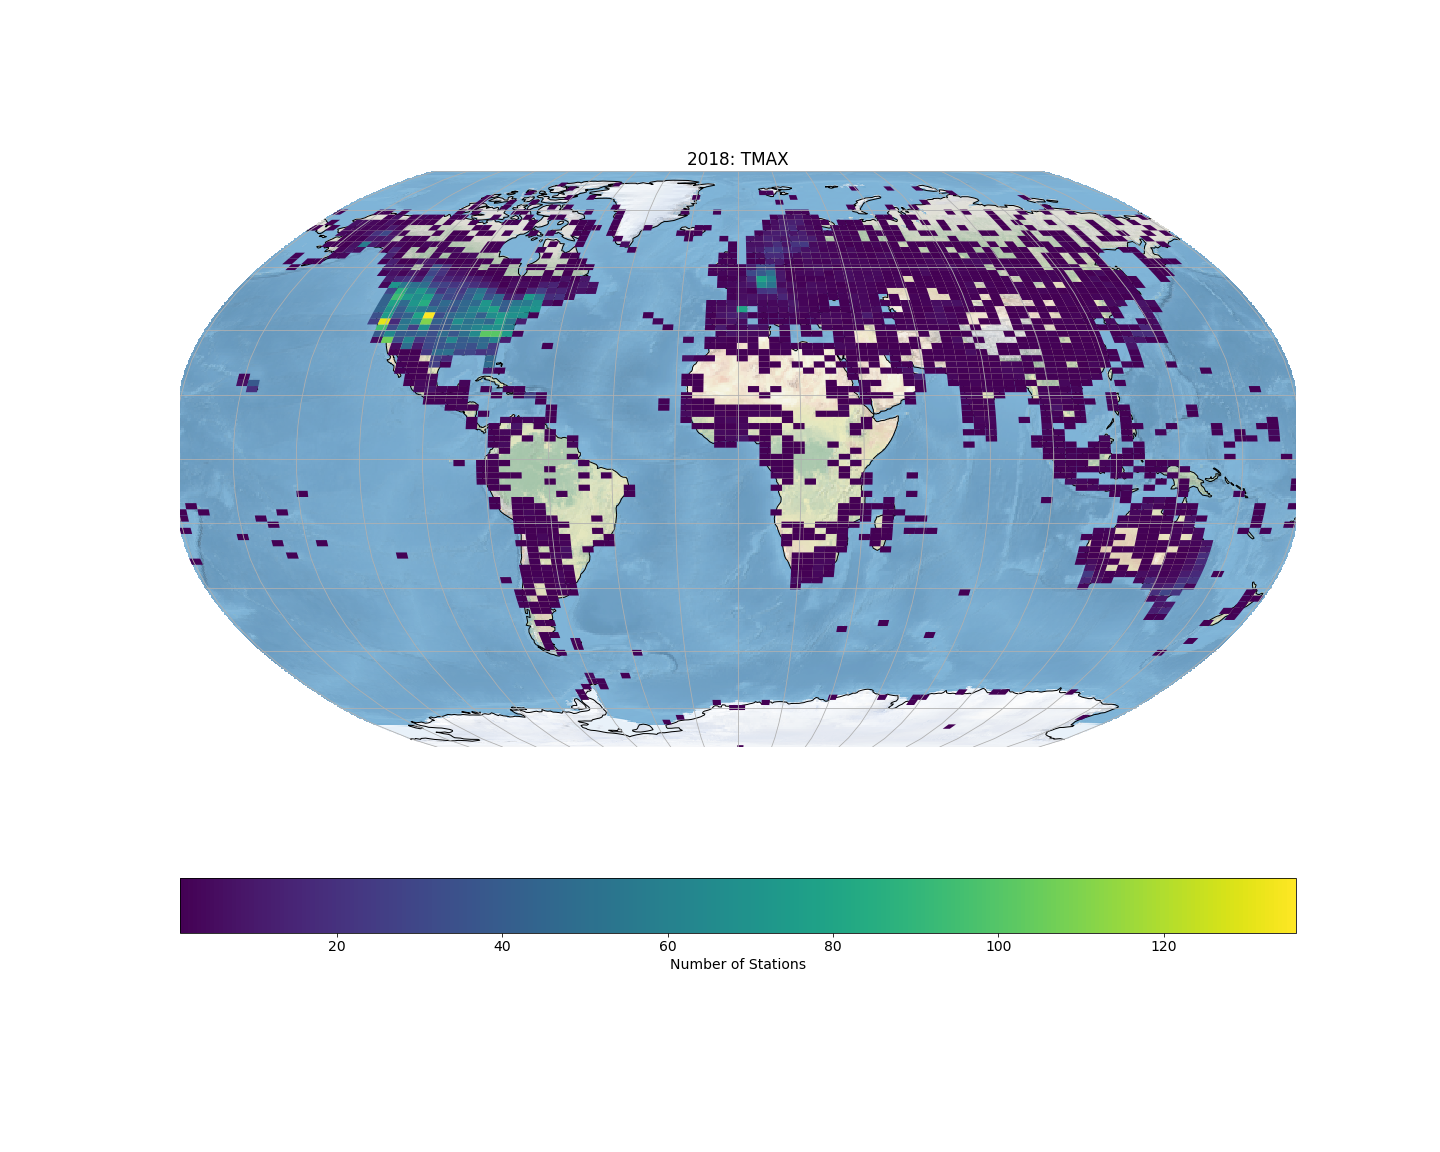
Daily Maximum Temperature
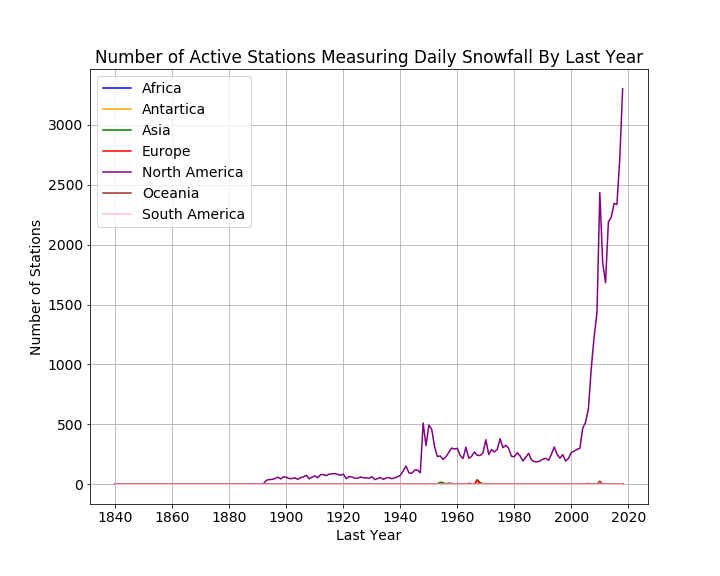
Daily Snowfall
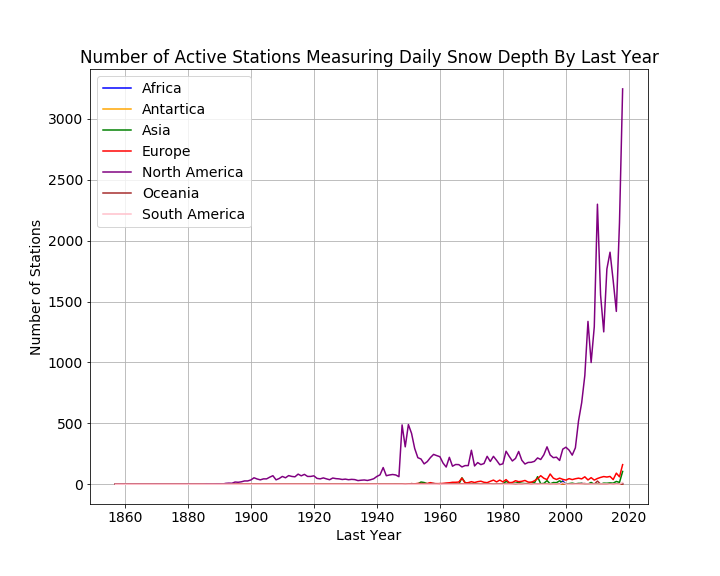
Daily Snow Depth
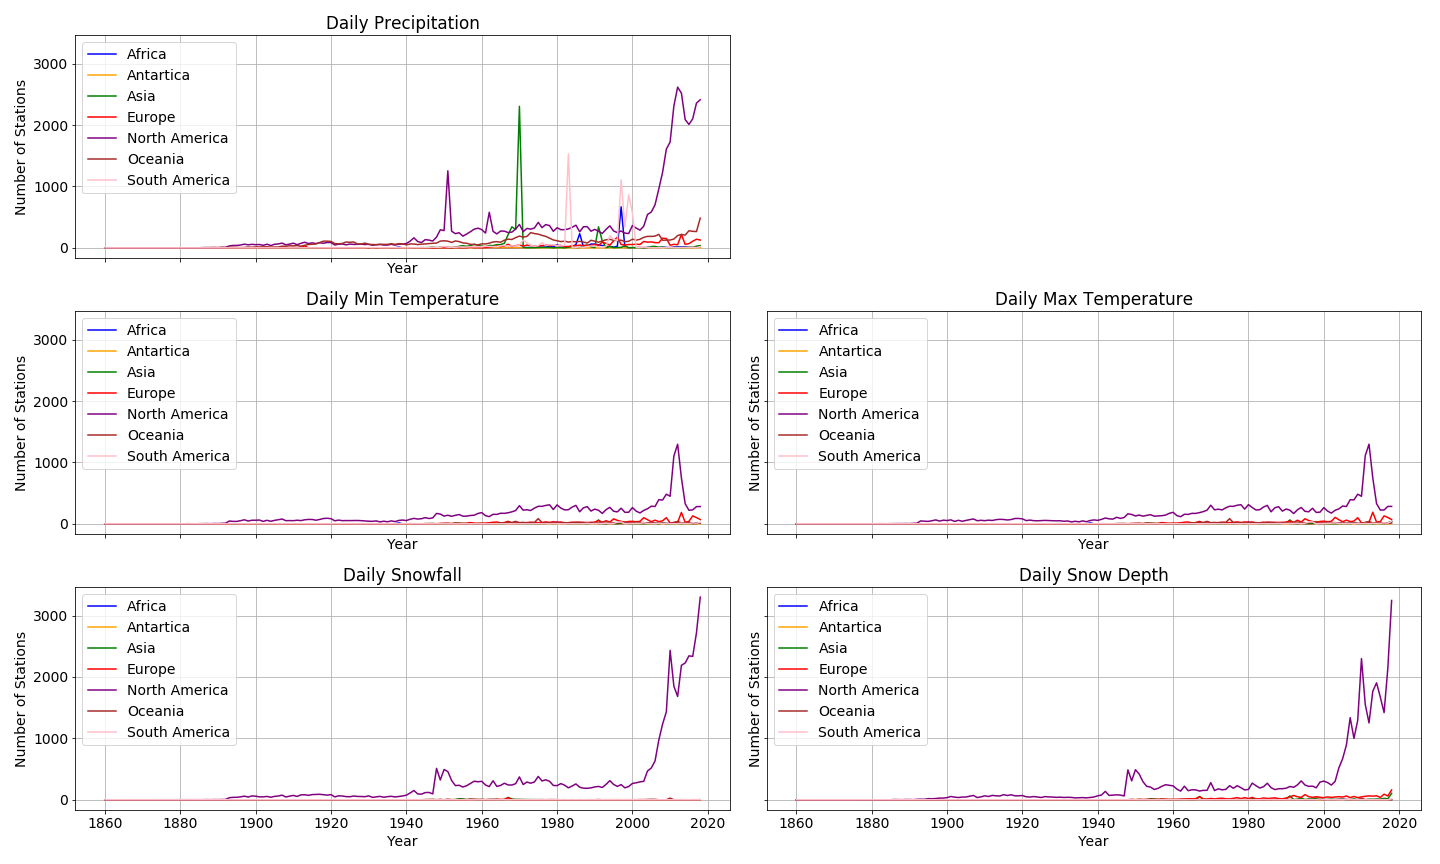
Note that the plots are not given in the same scales. This was done to show more detail for the different measurements across the continents.
The plots for daily minimum and maximum temperature are similar and suggest an increasing trend over time across continents. We see a very sharp increase in stations no longer recording these meteorological variables in North America just after 2010.
The plots for daily snowfall and snow depth are similar. We see an increasing trend for stations no longer being included in the archive. The trend for North America increases signigicantly after 2000.
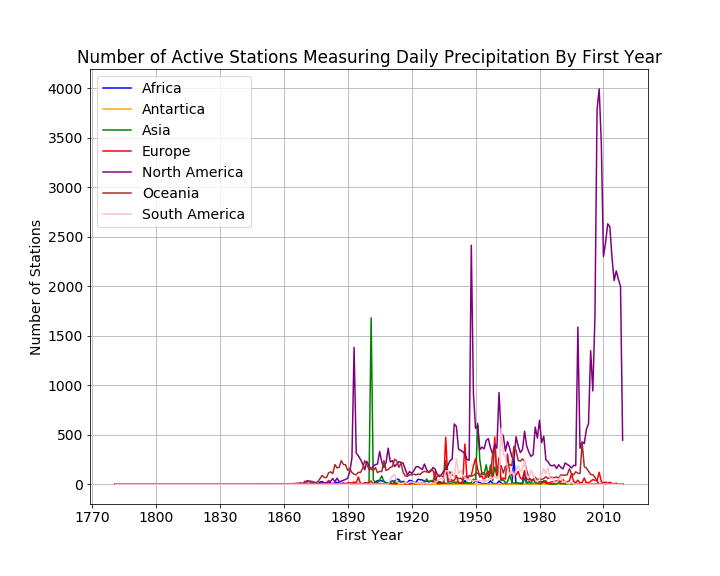
The plot for daily precipitation also suggests an increasing trend over time across continents; however, there are many obvious spikes in the time series. This is often the result of historical records for daily precipitation not continuing to the present day (Menne et. al. (2012)). We see large spikes in North America in 1950 and just after 2010. There is a large spike before 1970 for Asia when a historical collection of precipitation data in India ended. There are also noticeable spikes for South America and Africa in the early 1980s and 1990s.
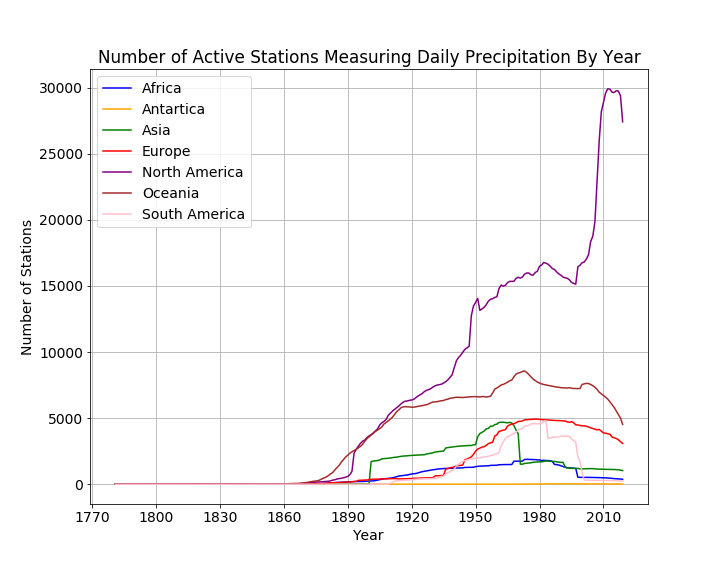
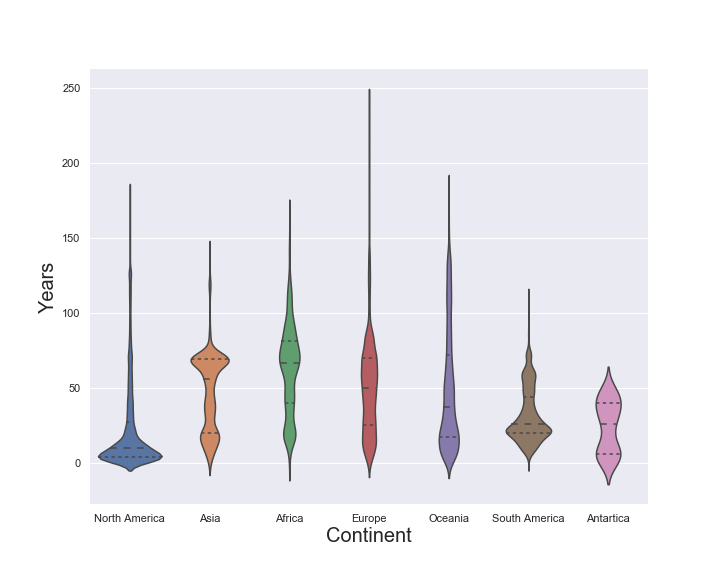
The following plot gives the above five plots with fixed axes.
Menne, M.J., I. Durre, R.S. Vose, B.E. Gleason, and T.G. Houston, 2012: *An overview of the Global Historical Climatology Network-Daily Database*. Journal of Atmospheric and Oceanic Technology, 29, 897-910, doi:10.1175/JTECH-D-11-00103.1.
Visualizations