Summary: GHCN Network of Stations
This project considered data available in the Global Historical Climate Network (GHCN). As described by GHCN, the GHCN is collection of meteorological summaries from land surface stations across the globe. The summaries are subjected to quality assurance reviews before inclusion into the archive. Sources for the archive are varied and described in detail by Menne et. al. (2012).
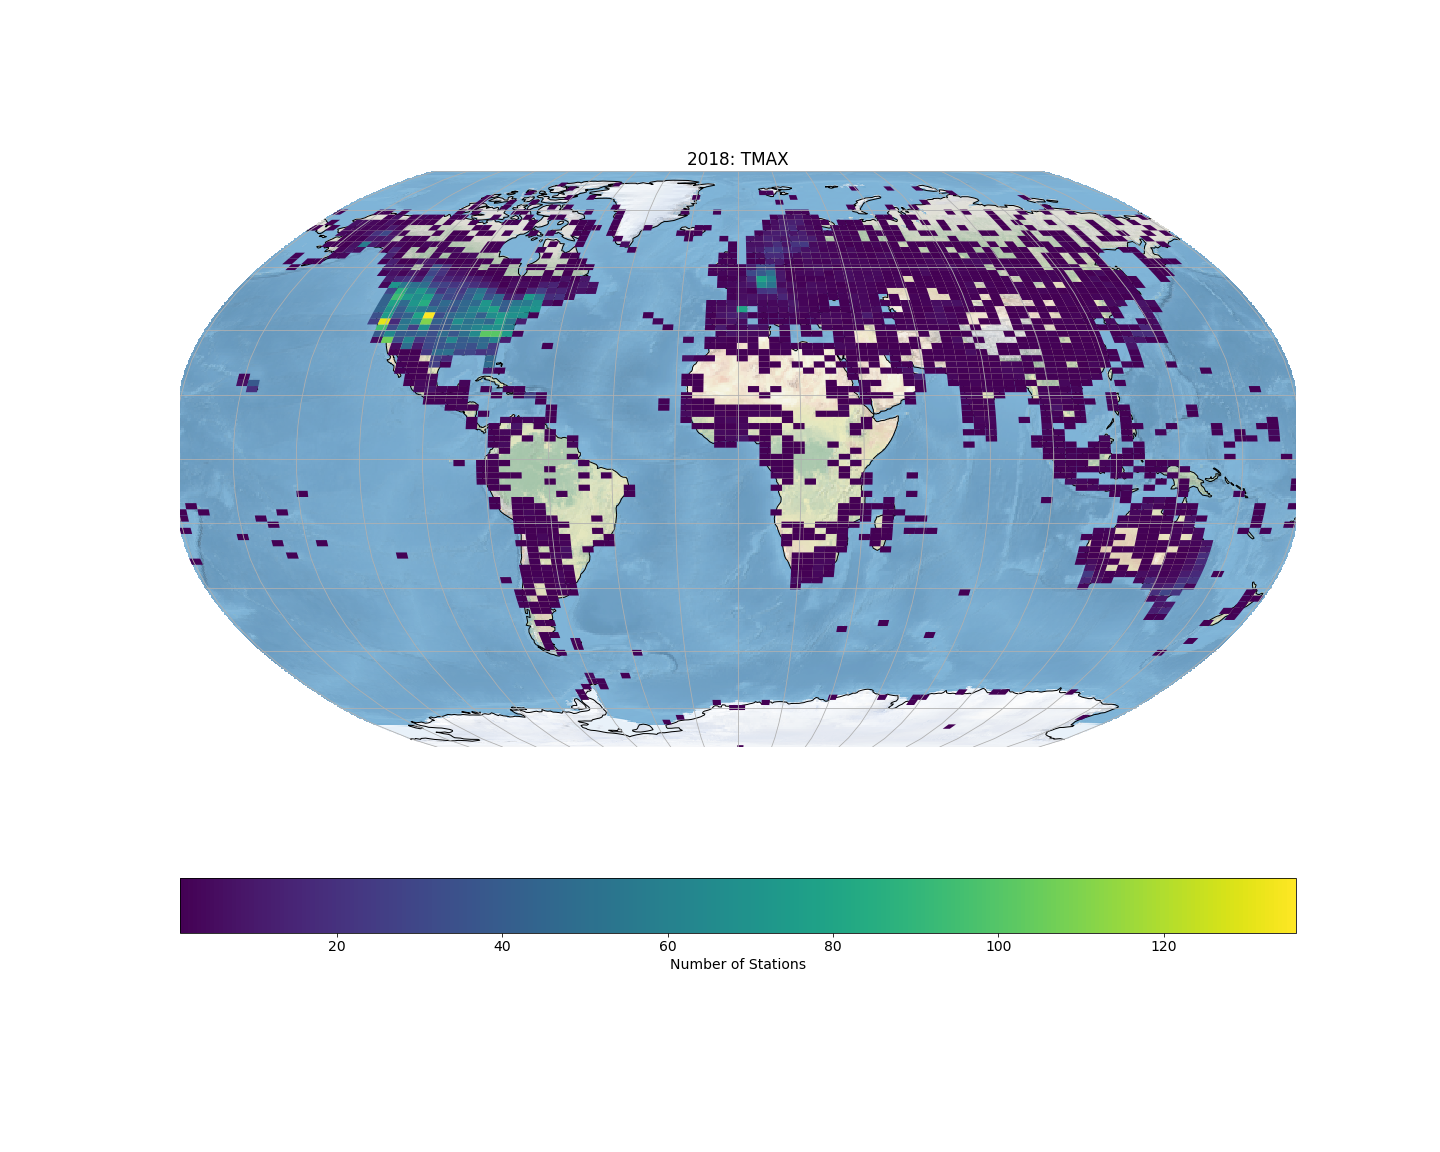
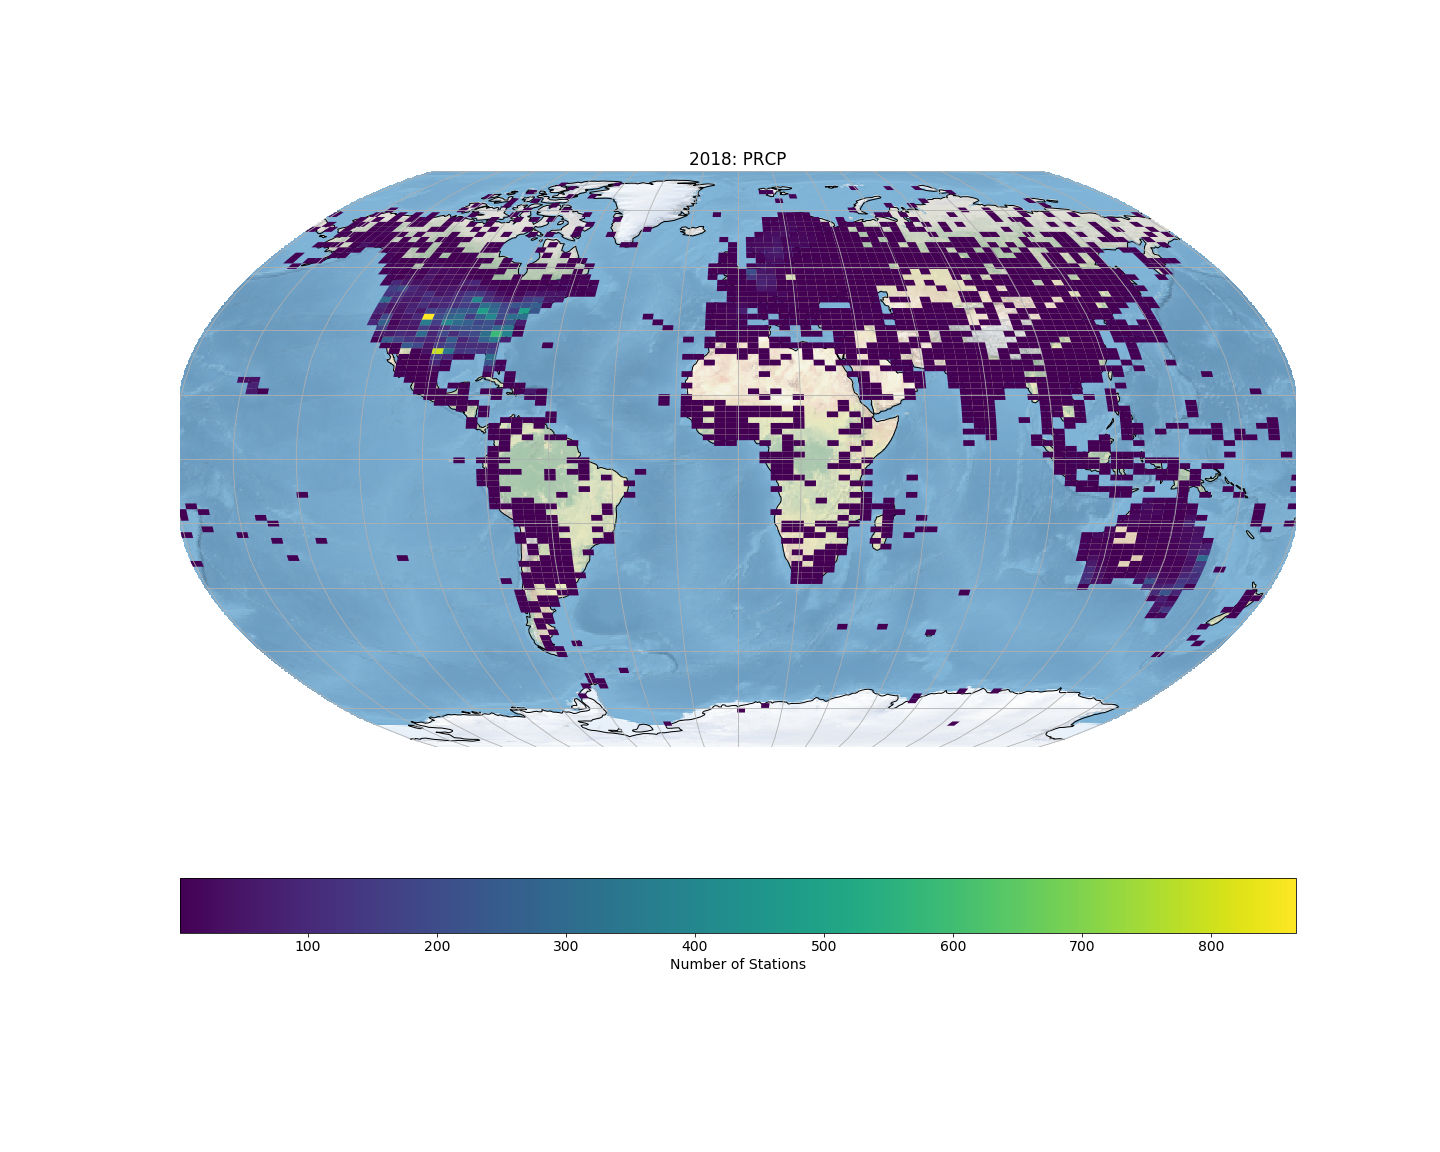
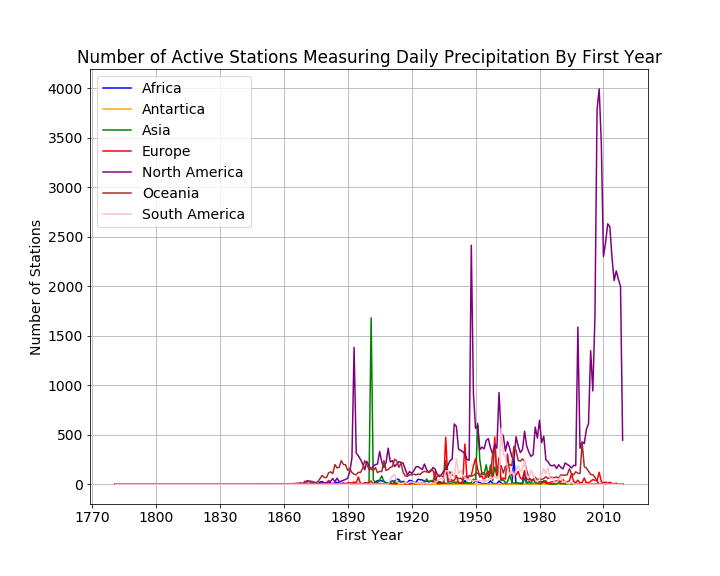
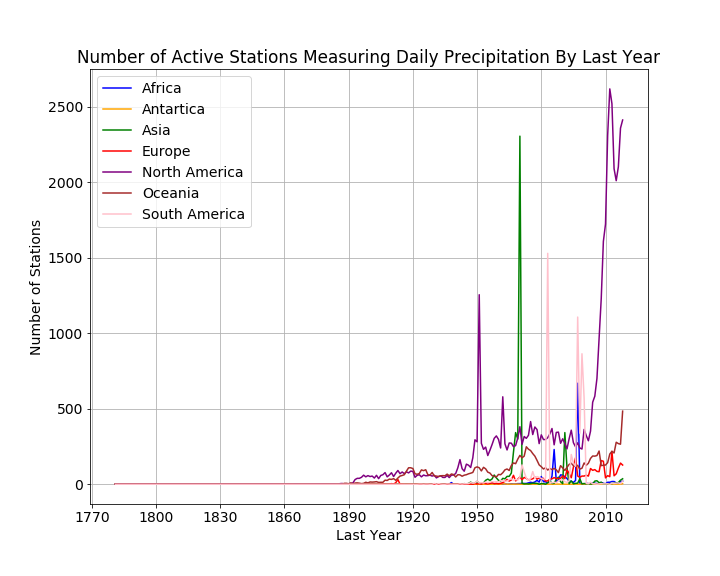
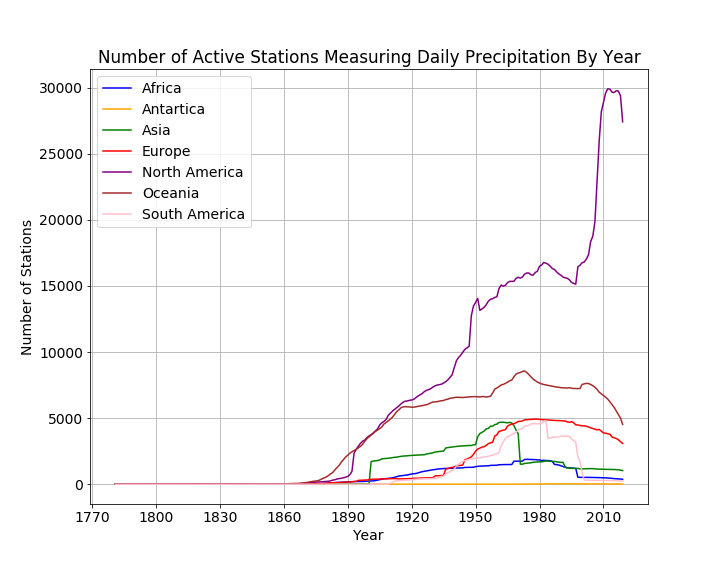
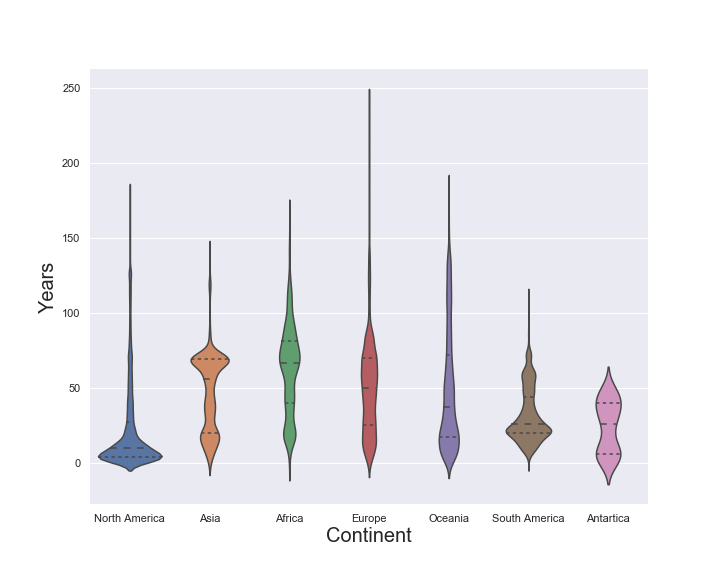
Plots were created using matplotlib, Geoplot (CartoPy), and seaborn to explore the GHCN station network. Factors that were considered were location of stations (continent), type of measurement recorded by the stations, duration of measurements by the stations and the evolution of the network over time and location. In addition, for the North American stations, we consider how the network of stations has changed over time with respect to the type of station. We only conisider five primary meteorological factors: daily precipitaion (PRCP), daily minimum temperature (TMIN), daily maximum temperature (TMAX), daily snowfall (SNOW) and daily snow depth (SNWD).
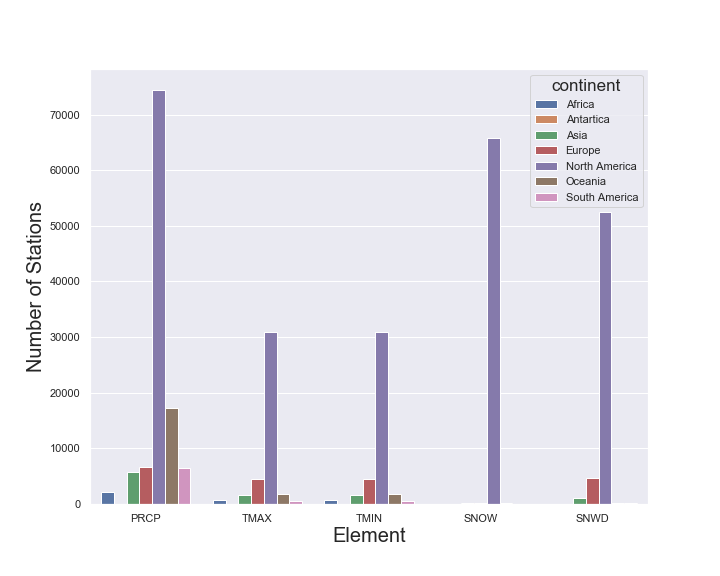
The plot above is a bar plot of the number of stations reporting each type of element across the different continents. We see that stations in North America make up the majority of the stations for each type of measurement. Stations reporting precipitation outnumber the stations reporting the other elements. Daily snowfall is almost unique to North America; daily snow depth is reported more frequently than daily snowfall outside North America. We have given the data used in the bar plot in the table below.
| Element | Africa | Antartica | Asia | Europe | North America | Oceania | South America |
|---|---|---|---|---|---|---|---|
| PRCP | 2104 | 55 | 5698 | 6703 | 74440 | 17263 | 6500 |
| TMAX | 690 | 61 | 1609 | 4521 | 30949 | 1801 | 463 |
| TMIN | 688 | 63 | 1609 | 4522 | 30838 | 1799 | 467 |
| SNOW | 8 | 16 | 153 | 91 | 65842 | 130 | 4 |
| SNWD | 86 | 37 | 995 | 4658 | 52549 | 130 | 106 |
We also give the number of unique stations per continent in the archive. Note that the column totals from the table above will not be equal to the values in the table below since many stations report more than one type of meteorological element.
| Continent | Number of Unique Station IDs |
|---|---|
| North America | 76073 |
| Oceania | 17283 |
| Europe | 6964 |
| South America | 6506 |
| Asia | 5717 |
| Africa | 2116 |
| Antartica | 107 |
Menne, M.J., I. Durre, R.S. Vose, B.E. Gleason, and T.G. Houston, 2012: *An overview of the Global Historical Climatology Network-Daily Database*. Journal of Atmospheric and Oceanic Technology, 29, 897-910, doi:10.1175/JTECH-D-11-00103.1.
Menne, M.J., I. Durre, B. Korzeniewski, S. McNeal, K. Thomas, X. Yin, S. Anthony, R. Ray, R.S. Vose, B.E.Gleason, and T.G. Houston, 2012: *Global Historical Climatology Network - Daily (GHCN-Daily)*, Version 3.27.
