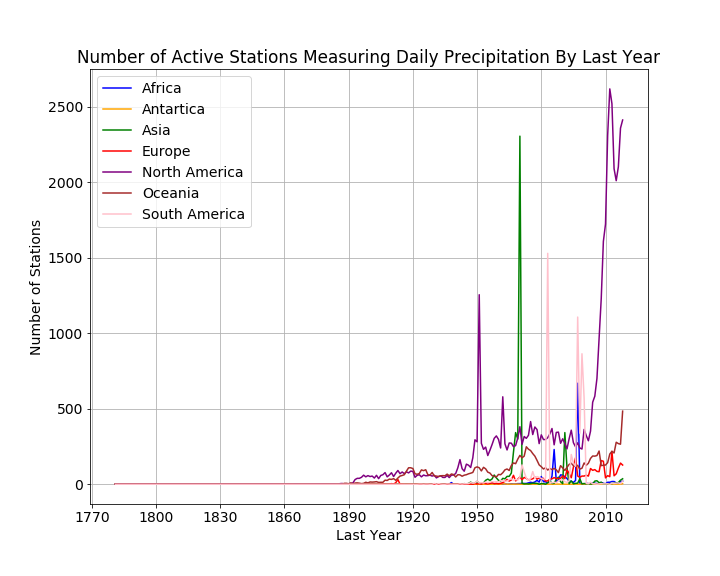
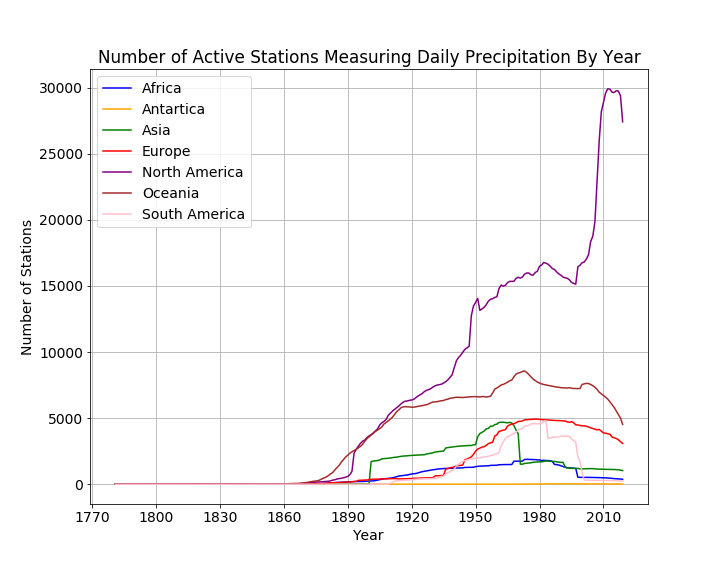
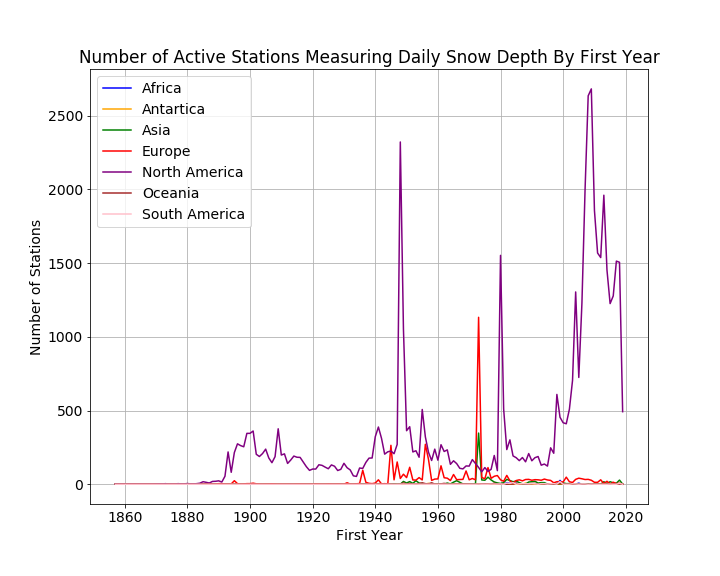
Number of Active Stations By First Year of Record
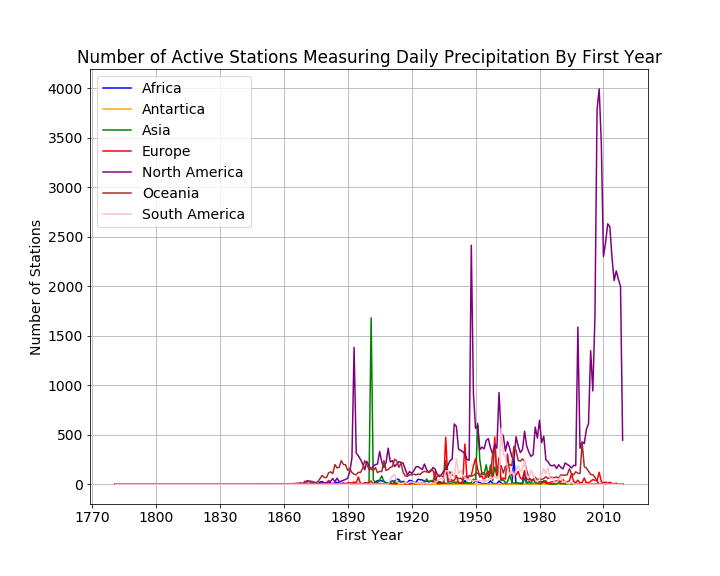
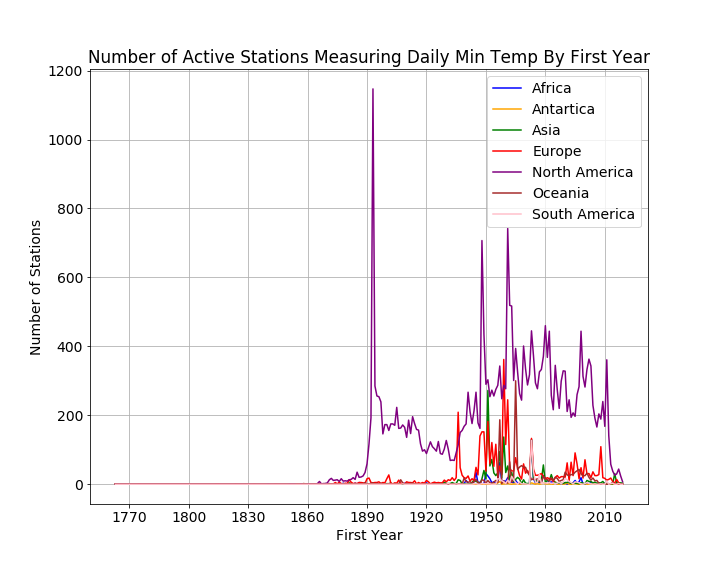
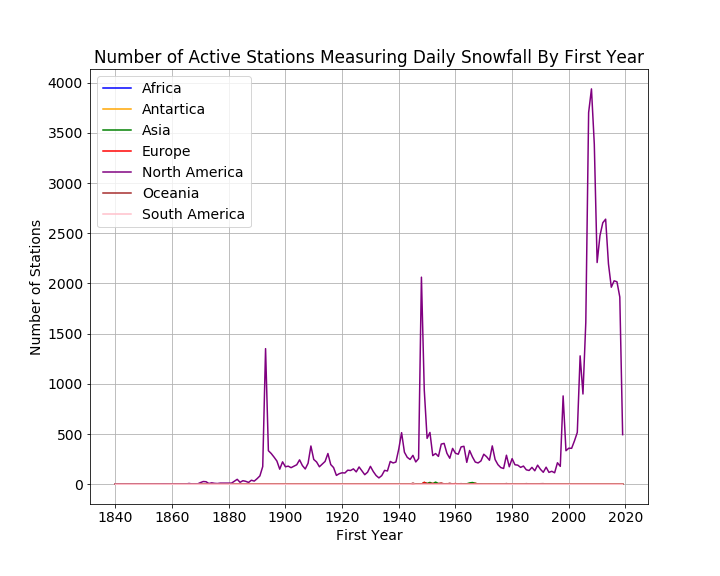
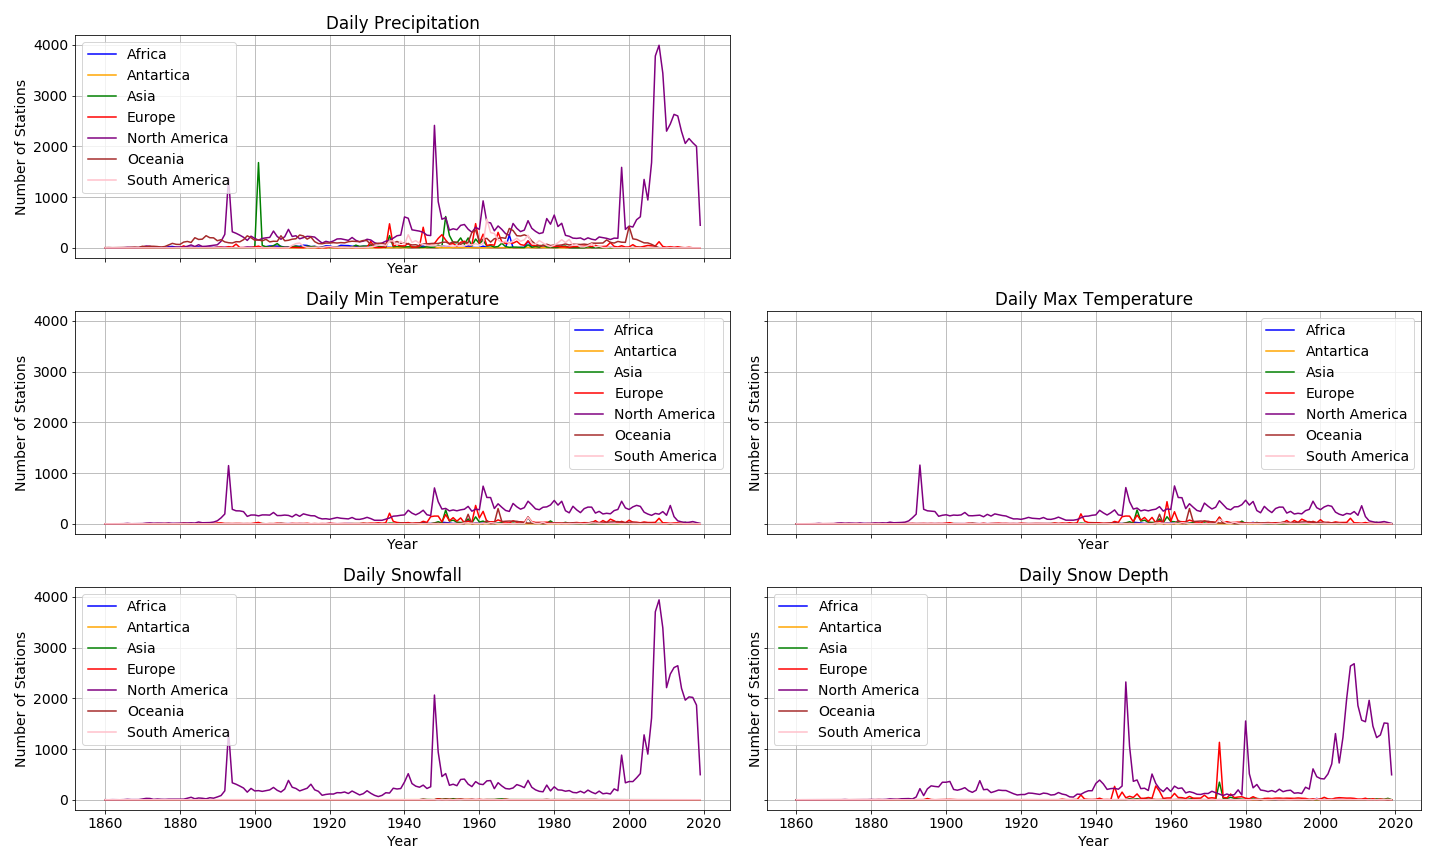
The following plots give the number of stations reporting the different types of observations in their first year. This is measuring the growth of station data over time as stations are added to the archive.
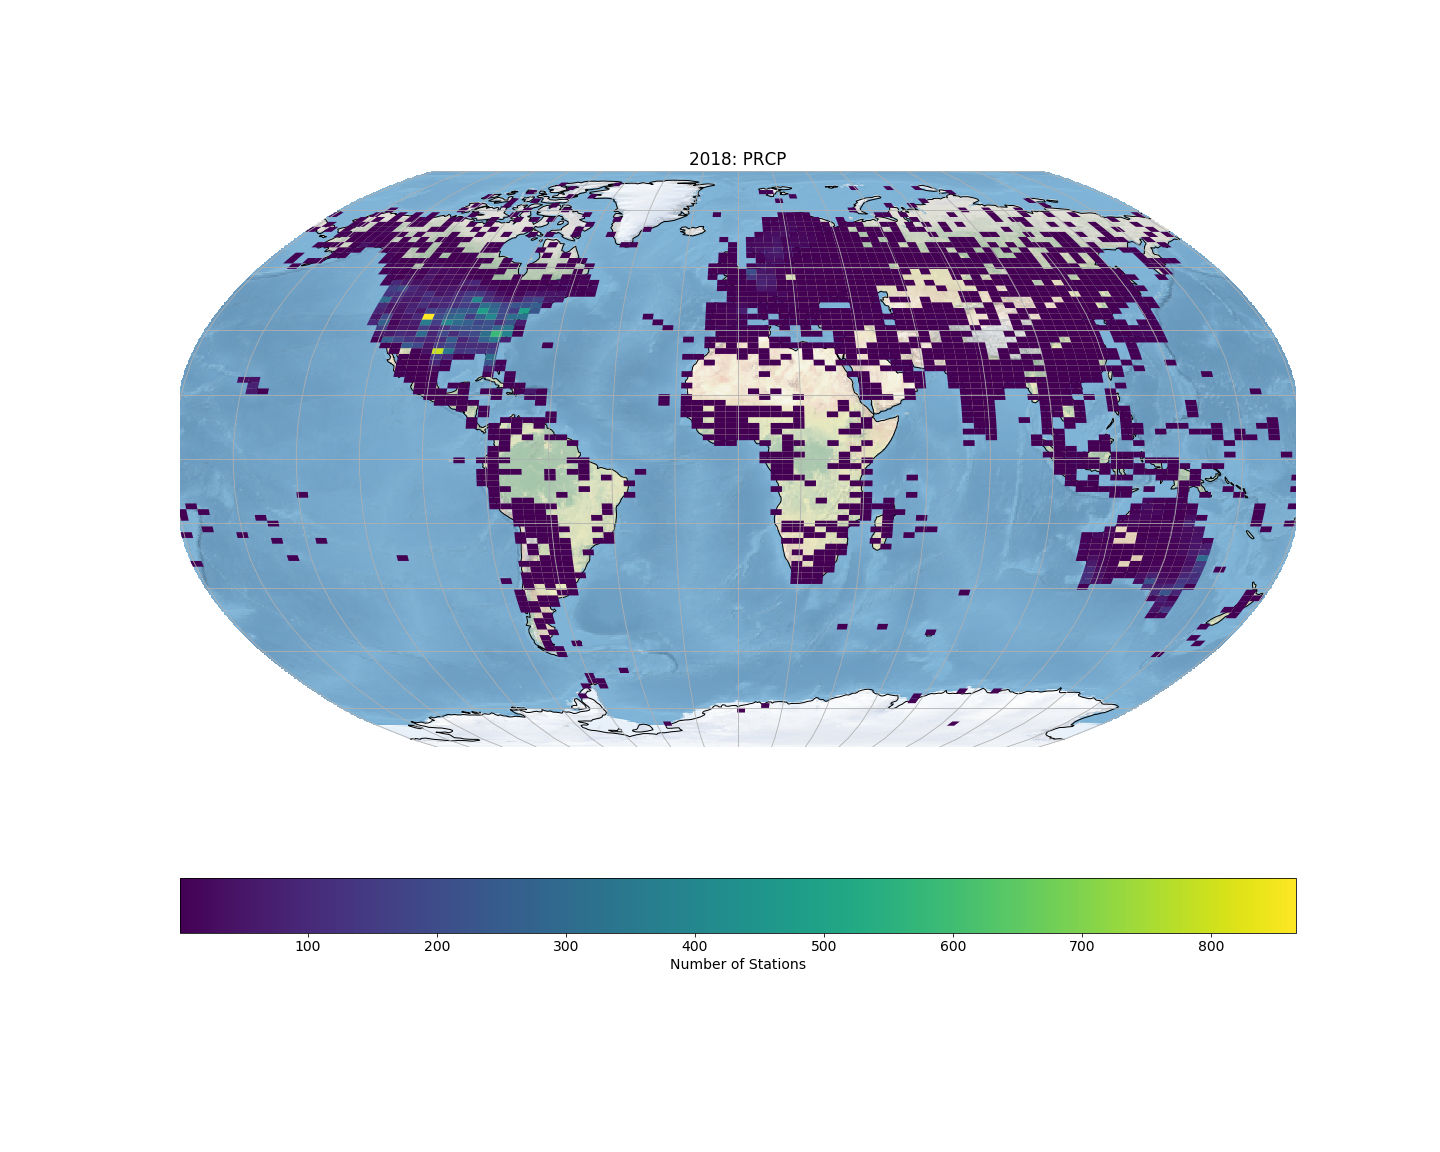
Daily Precipitation
Daily Minimum Temperature
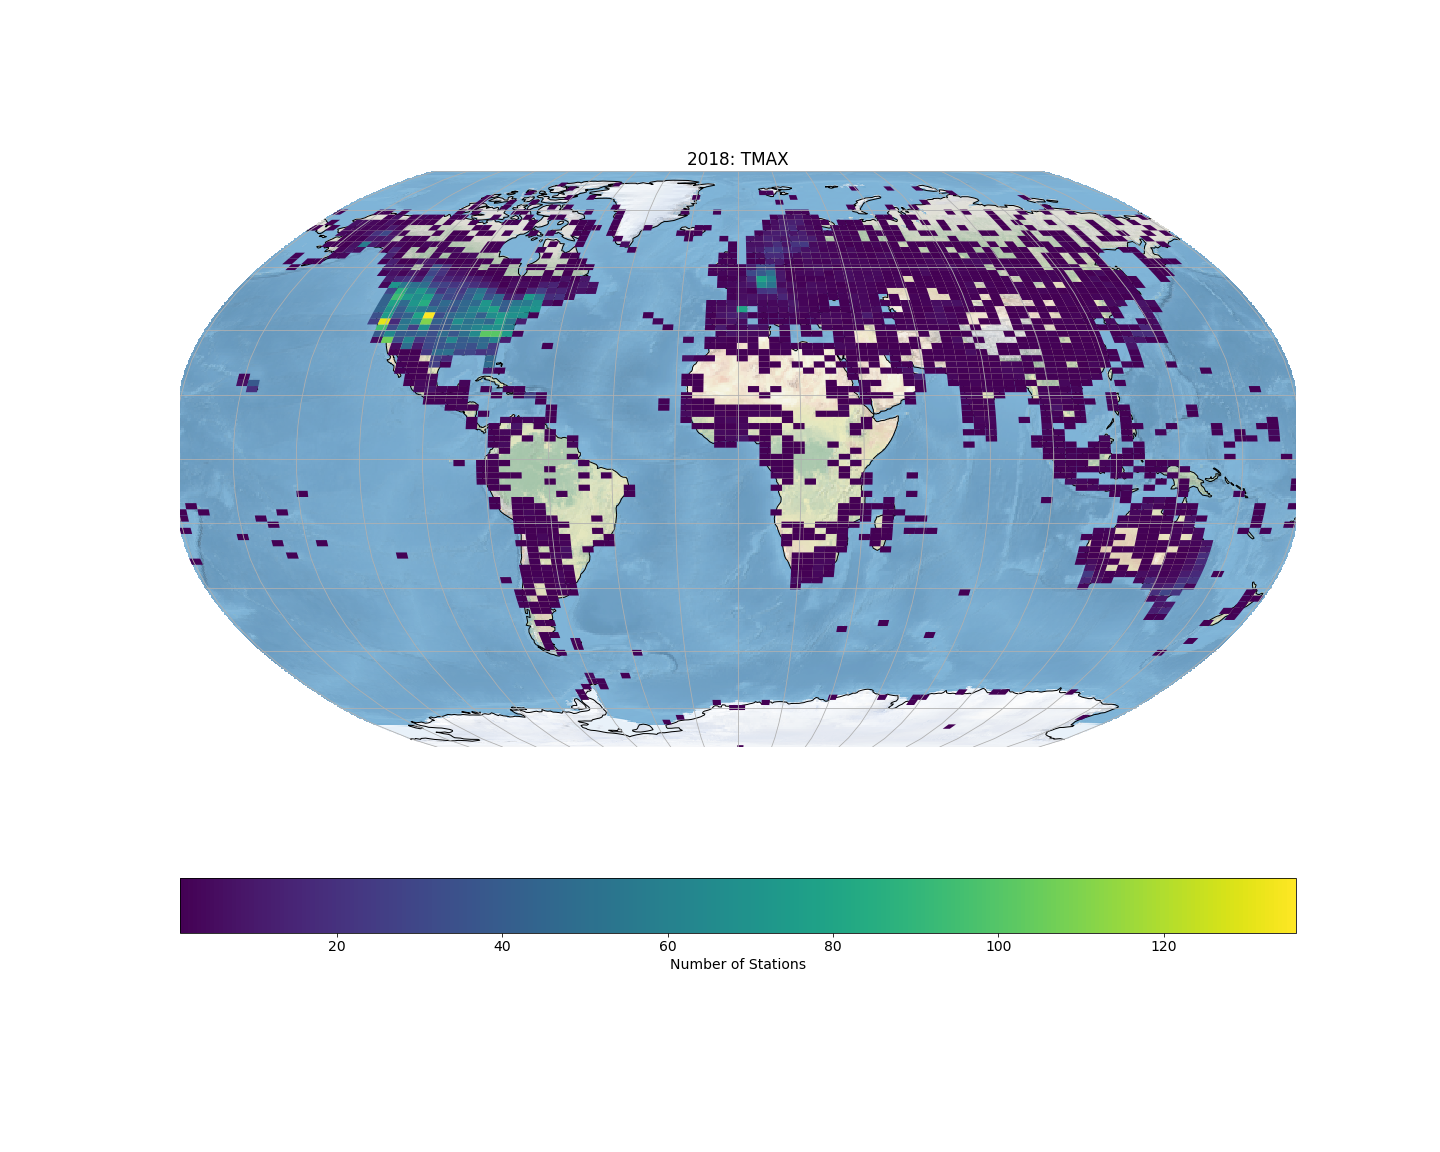
Daily Maximum Temperature

Daily Snowfall
Daily Snow Depth
Note that the plots are not given in the same scales. This was done to show more detail for the different measurements across the continents.
The plots contain prominent spikes which often mark the inclusion of historical records into the GHCN archive (Menne et. al. (2012)). For example, the large spike at 1890 for North America is the result of the inclusion of U.S. Forts and Voluntary Observers dataset. The large spike near 1900 for Asia is from the inclusion of a large historical collection of observations from India.
We see a rapid increase in the number of precipitation, snowfall and snow depth stations in North America after 2000. These stations are primarily the Community Collaborative Rain, Hail and Snow Network CoCoRaHS of volunteer stations which began in 1998.
The following plot gives the above five plots with fixed axes.
Menne, M.J., I. Durre, R.S. Vose, B.E. Gleason, and T.G. Houston, 2012: *An overview of the Global Historical Climatology Network-Daily Database*. Journal of Atmospheric and Oceanic Technology, 29, 897-910, doi:10.1175/JTECH-D-11-00103.1.
Visualizations