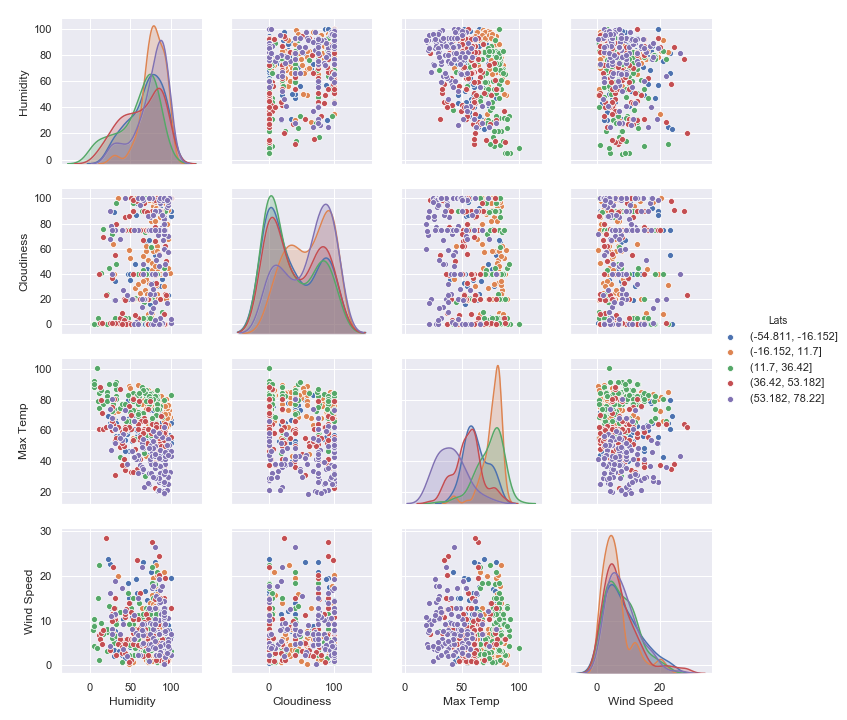
If one divides the observations by latitude into 5 bins with an equal number of observations, one can see how the weather factors change with latitude as seen in the plot below.
The distribution of humidity has a similar shape across the 5 regions of latitude; however, it is less spread out for latitudes near the equator and latitudes above 50.
The distributions of cloudiness are bimodal but the highest peak in the distribution depends on the latitude.
The distributions of temperature are unimodal but the direction of skewness in the distribution depends on the latitude.
The distribution of wind speed has a similar shape across the 5 regions of latitude; however, it is less spread out for latitiudes near the equator.